

Predicting peptide structures in native proteins from physical simulations of fragments
- PMID: 19197352
- PMCID: PMC2629132
- DOI: 10.1371/journal.pcbi.1000281
Predicting peptide structures in native proteins from physical simulations of fragments
Abstract
It has long been proposed that much of the information encoding how a protein folds is contained locally in the peptide chain. Here we present a large-scale simulation study designed to examine the extent to which conformations of peptide fragments in water predict native conformations in proteins. We perform replica exchange molecular dynamics (REMD) simulations of 872 8-mer, 12-mer, and 16-mer peptide fragments from 13 proteins using the AMBER 96 force field and the OBC implicit solvent model. To analyze the simulations, we compute various contact-based metrics, such as contact probability, and then apply Bayesian classifier methods to infer which metastable contacts are likely to be native vs. non-native. We find that a simple measure, the observed contact probability, is largely more predictive of a peptide's native structure in the protein than combinations of metrics or multi-body components. Our best classification model is a logistic regression model that can achieve up to 63% correct classifications for 8-mers, 71% for 12-mers, and 76% for 16-mers. We validate these results on fragments of a protein outside our training set. We conclude that local structure provides information to solve some but not all of the conformational search problem. These results help improve our understanding of folding mechanisms, and have implications for improving physics-based conformational sampling and structure prediction using all-atom molecular simulations.
Conflict of interest statement
The authors have declared that no competing interests exist.
Figures
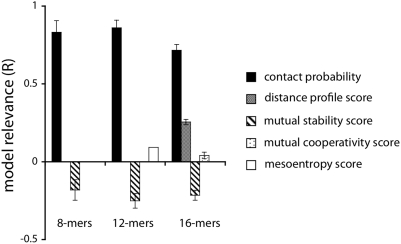
 values show that contact probability (CPROB) is the most important metric in predicting whether a contact observed in the computer simulations is likely to be in the native structure of the protein. The model relevance
  of a contact metric
  is defined as
  , where
  is the logistic regression coefficient for the metric, and
  is the standard deviation of the metric.
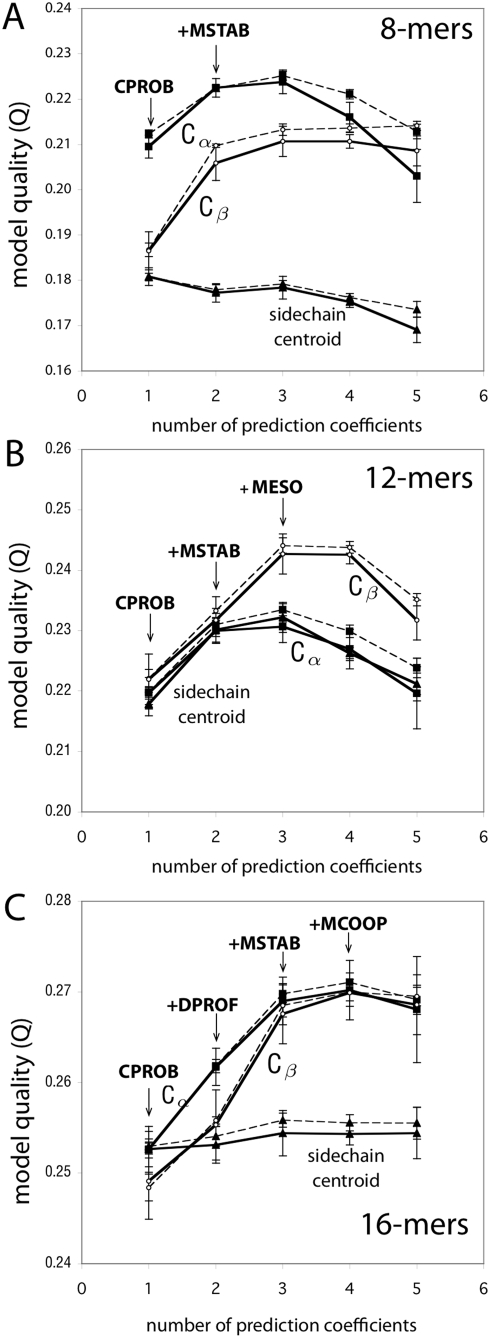
 , and sidechain-centroid), shown is the model quality (Q) for a series of models, calculated from the training data (dotted) and the testing data (solid) (see Methods for details). The larger the
  value, the more predictive the model. From left to right, the model quality (Q) for the best 1-, 2-, 3-, 4-, and 5-metric regression models are plotted, labeled with the sequence of additional metrics that increasingly improve the model quality.
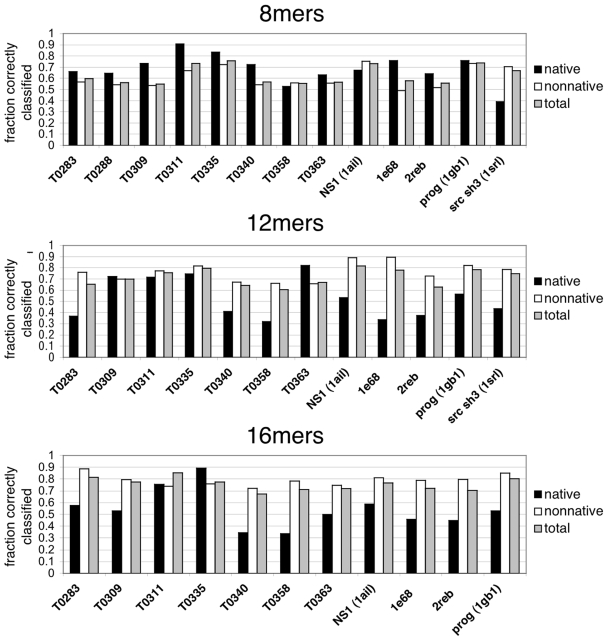
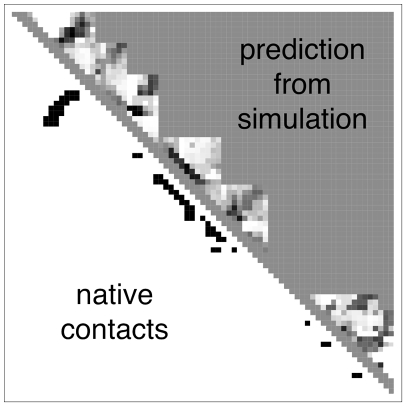
 given by the best logistic regression model trained on all the 16-mer simulation data. The background gray value corresponds to contacts not sampled by the fragment simulations, and is colored according to the logit value threshold
  used for the classification criterion; logit values
  are classified as native and appear darker, while logit values
  are classified as non-native and appear lighter. On the lower diagonal are shown the native contacts in the range sampled by the fragment simulations. (8-mer, 12-mer, and 16-mer predictions for all targets are shown in Text S1.)
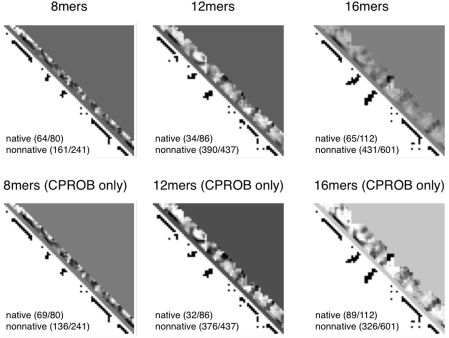
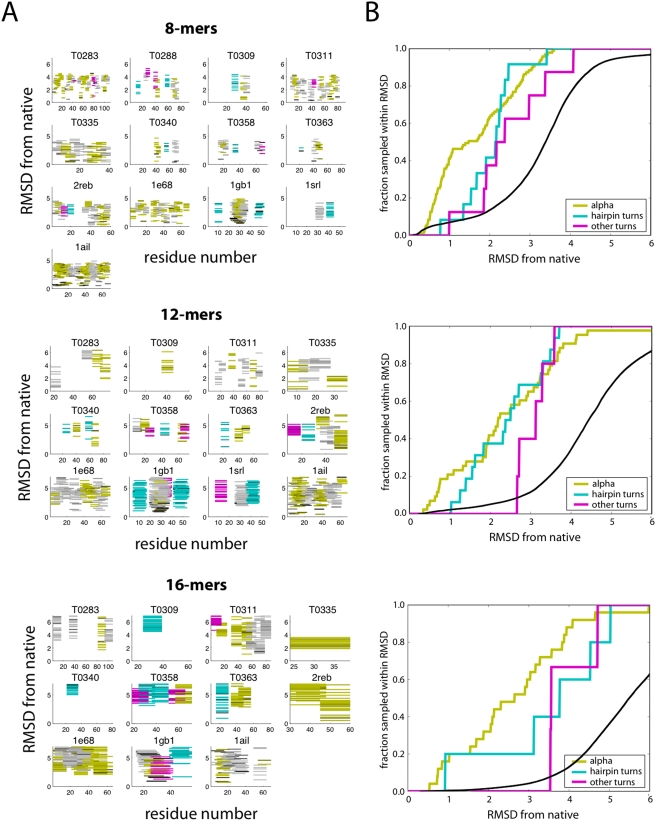
 with prediction success rates. The lower diagonal shows native contacts in the range sampled by the fragment simulations. As the fragment simulations increase in length, clear signals of predicted secondary structures begin to emerge. For comparison (bottom row) are shown the logit values and prediction scores given by the best regression model trained only on contact probability. The similarity of the two models shows that most of the predictive power comes directly from the frequency of contacts observed in the simulation data.
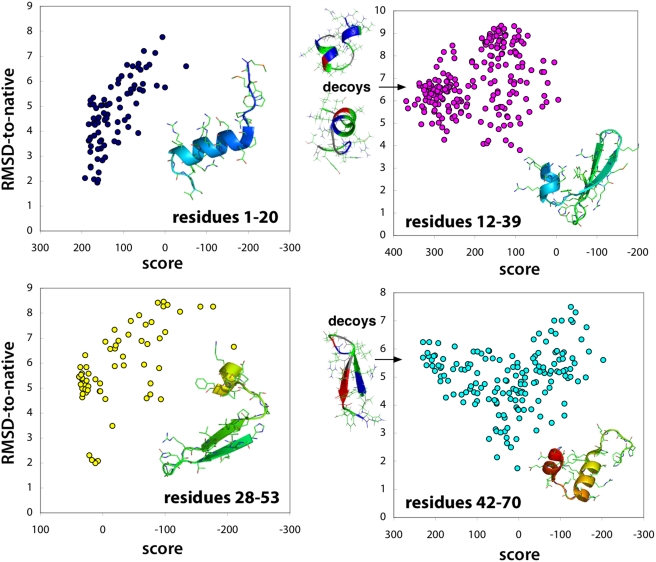
 ,
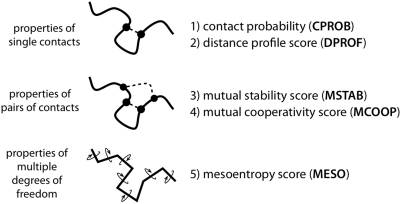
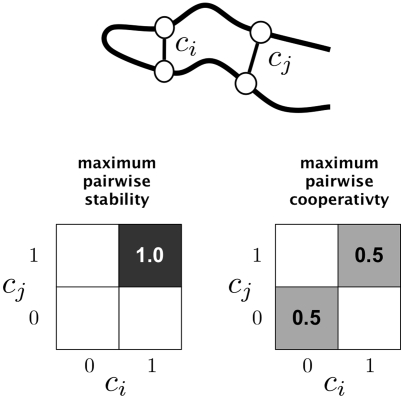
,  are indicator variables: 1 if the contact is made, and 0 if the contact is not made. The pairwise distribution
  represents the joint probability of contacts
  being made or not. Pairwise stability is at a maximum when both contacts
  are made with a probability of 1. Pairwise cooperativity is maximized when
  are formed in an all-or-nothing way, so as to maximize the mutual information between
  .
.References
-
- Simons K, Kooperberg C, Huang E, Baker D. Assembly of protein tertiary structures from fragments with similar local sequences using simulated annealing and bayesian scoring functions. J Mol Biol. 1997;268:209–225. - PubMed
-
- Rohl C, Strauss C, Misura K, Baker D. Protein structure prediction using rosetta. Methods Enzymol. 2004;383:66–93. - PubMed
-
- Voelz VA, Dill KA. Exploring zipping and assembly as a folding principle. Proteins: Structure, Function, and Bioinformatics. 2007;66:877–888. - PubMed
Publication types
MeSH terms
Substances
Grants and funding
LinkOut - more resources
Full Text Sources
Miscellaneous
