. 2009 Mar;16(3):238-46.
doi: 10.1038/nsmb.1558. Epub 2009 Feb 8.

Phosphorylation-mediated unfolding of a KH domain regulates KSRP localization via 14-3-3 binding

Affiliations

Phosphorylation-mediated unfolding of a KH domain regulates KSRP localization via 14-3-3 binding

Irene Díaz-Moreno et al. Nat Struct Mol Biol. 2009 Mar.

Abstract

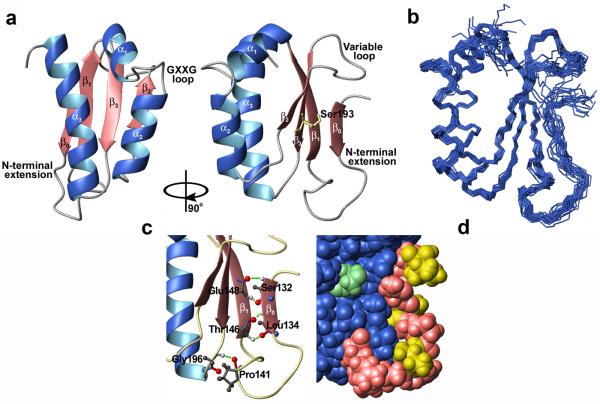
The AU-rich element (ARE)-mediated mRNA-degradation activity of the RNA binding K-homology splicing regulator protein (KSRP) is regulated by phosphorylation of a serine within its N-terminal KH domain (KH1). In the cell, phosphorylation promotes the interaction of KSRP and 14-3-3zeta protein and impairs the ability of KSRP to promote the degradation of its RNA targets. Here we examine the molecular details of this mechanism. We report that phosphorylation leads to the unfolding of the structurally atypical and unstable KH1, creating a site for 14-3-3zeta binding. Using this site, 14-3-3zeta discriminates between phosphorylated and unphosphorylated KH1, driving the nuclear localization of KSRP. 14-3-3zeta -KH1 interaction regulates the mRNA-decay activity of KSRP by sequestering the protein in a separate functional pool. This study demonstrates how an mRNA-degradation pathway is connected to extracellular signaling networks through the reversible unfolding of a protein domain.


Figures

Figure 1
Figure 1. Domain structure and sequence alignment of the KSRP protein
(a) Domain organization of KSRP (top) and constructs used in this study (below). KH domains are indicated by light grey shadowing. The dark grey shadowing N-terminal to KH1 indicates an extension of the classical KH fold. (b) Sequence alignment of the four KH domains of KSRP (top) and of KH1 domains in the FBP2/FBP family (bottom). The rat (Rattus norvegicus, MARTA1), chicken (Gallus gallus, ZBP2) and frog (Xenopus laevis, VgRBP71) homologues and the human FUSE binding protein (FBP1), are aligned with human KSRP. Strictly conserved residues in two or more domains are colored in blue and green; conservative substitutions of hydrophobic and polar residues are marked in gray and purple. Yellow boxes point out the position of Ser193; red boxes define the boundaries of the N-terminal extension at KH1. Secondary structure elements and loops are also shown. The FBP2 family sequence alignment indicates that a 13-amino acid stretch amino-terminal to the core KH1 domain is conserved in the FBP2 but not in the FBP family.
Figure 2
Figure 2. High resolution solution structure of KSRP KH1 domain
(a) 90° rotated ribbon representations of the solution structure of the KSRP KH1130–218 domain. The side-chain of Ser193 on the β3 is displayed in yellow. The N-terminal extension folds back to join the antiparallel β sheet. (b) Superposition of the KH1 Cα trace for the 25 lowest energy conformers plus the average structure. (c) Close-up of the β0 - β1 and of the turn03 interactions. The hydrogen bonds between Ser132 HN and Glu148 O, Ser132 O and Glu148 HN, Leu134 HN and Thr146 O, Leu134 O and Thr146 HN, Pro141 O and Gly196 HN are indicated by green lines. The side-chains of Pro141 and Gly196 are displayed. (d) A space-filling (CPK) representation of the close-up in panel (c). The N-tail extension is in pink with hydrophobic amino acids in yellow. The classical KH fold is in blue with the Ser193 residue marked in green. The interaction between the two elements (including the Proline-rich loop) buries ~980Å2 of exposed surface.
Figure 3
Figure 3. KH1 and KH2 do not make contact
a) Superimposition of 15N-HSQC spectra of KH1143–218 (yellow), KH2233-305 (magenta) and KH12143–305 (gray). No appreciable chemical-shift perturbations (Δδavg > 0.02 ppm) are observed between corresponding resonances in the one- and two-domain constructs. The larger of these shifts are observed for a small (4-5) set of resonances in KH2, and we can attribute them to very transient contacts between KH2 and the flexible linker. The comparison of the spectra of KH1, KH2 and KH12 indicates that the two domains are not interacting. b) Comparison of the backbone 15N T1, T2 and 15N{1H} NOE measurements for KH1143–218 and KH2233-305 (gray) and KH12143–305 (black). The trend of relaxation parameters along the sequence is the same in the isolated and two-domain constructs. (c) 220 nm CD signal of KH1130–218, KH2233–305 and KH12130–305 recorded during a thermal denaturation experiment. The fitted curves of unfolding are represented in cyan, magenta and green, respectively and are superimposed on experimental data in gray. Protein unfolding is reversible in all cases and transition mid-points, marked by a dashed line, do not change substantial in the two domain construct.
Figure 4
Figure 4. KH1 phosphorylation by AKT kinase
(a) Superimposition of SOFAST 15N-HMQC spectra of the HPLC-purified non-phospho (cyan) and phospho (yellow) KH1. The phospho-KH1 is unfolded. (b) Superimposition of CD spectra of phospho-KH1 recorded at 20 (black), 40 (blue), 60 (green), 80 (red) and 95 (yellow) °C. The spectra do not change substantially at increasing temperatures. (c) Superimposition of SOFAST 15N-HMQC spectra of non-phospho (cyan), phospho (yellow) and de-phospho (magenta) KH1 domain. KH1 de-phosphorylation results in refolding of the domain.
Figure 5
Figure 5. KH1 S193A and S193D mutants
(a) Superimpositions of 15N-HSQC spectra of KH1 wild type (cyan) to S193A (magenta) (top) and wild type (cyan) to S193D (yellow) (bottom). With the exception of the resonances of residues close to Ser193, the S193A spectrum resembles the wild type one. Contrarily, S193D mutant is partially unfolded with both native and denatured, forms in equilibrium at 27 °C. The shift of the amide resonance of residue 193 is highlighted by arrows in the two superimpositions. (b) Superimposition of the 220 nm CD signals of KH1 wild type and S193A (top) and wild type and S193D (bottom) recorded during a temperature unfolding experiment. The fitted curves are colored as in (a) and superimposed on the experimental data (grey). For all constructs, protein unfolding is reversible with midpoints indicated by dashed lines. The S193D mutant is characterized by a lower Tm value compared with KH1 wild type and S193A mutant.
Figure 6
Figure 6. KH1–14-3-3ζ interaction
(a) Top - Superimposition of SOFAST 15N-HMQC spectra of 15 μM KSRP KH1 (black) and KH1+14-3-3 1:2 ratio (red). No appreciable change is observed in the spectrum of the domain. Middle - Superimposition of SOFAST 15N-HMQC spectra of 15 μM phospho-KH1 (cyan) and phospho-KH1+14-3-3 1:2 ratio (magenta). Selected resonances broaden substantially. Bottom - Superimposition of SOFAST 15N-HMQC spectra of 15 μM phospho-KH1+14-3-3 1:2 ratio (magenta) and phospho-KH1+14-3-3+KH1 phospho-peptide 1:2:10 ratios (green). The selective broadening caused by the interaction with phospho-KH1 is reversed by addition of the peptide, indicating that the short peptide compete effectively with the full-length domain. (b) Detail of SOFAST 15N-HMQC spectra of phospho-KH1 (top), phospho-KH1+14-3-3 1:2 ratio (middle) and phospho-KH1+14-3-3+KH1 phospho-peptide 1:2:10 ratios (bottom). Selective broadening of one of the two peaks is reversed by adding the peptide.
Figure 7
Figure 7. Sub-cellular KSRP localization
(a) Immunoblot analysis of either nuclear or S100 cytoplasmic extracts from either mock-αT3-1 and αT3-1-myrAKT1 cells with the specified antibodies. Asterisks mark the position of a non-specific band in anti-AUF1 immunoblot. (b) Immunoblot analysis of either nuclear or cytoplasmic extract from either control or insulin (10−6 M, 1h)-treated HIRc-B cells using the indicated antibodies. (c) Immunoblot analysis (antibodies are indicated) of either nuclear or cytoplasmic extracts from HEK293 cells transiently transfected with Flag-KH1-4 and either empty vector (mock) or myrAKT1 (AKT1) or myrAKT1 together with difopein expression vector (AKT1+ difopein). (d) Immunoblot analysis (antibodies are indicated) of either nuclear or cytoplasmic extracts from HEK293 cells transiently transfected with Flag-KSRP(S193A) and either empty vector (mock) or myrAKT1 (AKT1).

Similar articles

Cited by

References

    1. Audic Y, Hartley RS. Post-transcriptional regulation in cancer. Biol. Cell. 2004;96:479–498. - PubMed
    1. Kontoyannis D, Pasparakis M, Pizarro TT, Cominelli F, Kollias G. Impaired on/off regulation of TNF biosynthesis in mice lacking TNF AU-rich elements: implications for joint and gut-associated immunopathologies. Immunity. 1999;10:387–398. - PubMed
    1. Barreau C, Paillard L, Osborne HB. AU-rich elements and associated factors: are there unifying principles? Nucleic Acids Res. 2006;33:7138–7150. - PMC - PubMed
    1. Pullmann R, et al. Analysis of turnover and translation regulatory RNA-binding protein expression through binding to cognate mRNAs. Mol. Cell. Biol. 2007;27:6265–6278. - PMC - PubMed
    1. Chen C-Y, et al. AU binding proteins recruit the exosome to degrade ARE-containing mRNAs. Cell. 2001;107:451–464. - PubMed

Publication types

Associated data