. 2009 Mar;11(3):303-11.
doi: 10.1038/ncb1838. Epub 2009 Feb 8.

Intercellular transfer to signalling endosomes regulates an ex vivo bone marrow niche

Affiliations

Intercellular transfer to signalling endosomes regulates an ex vivo bone marrow niche

Jennifer M Gillette et al. Nat Cell Biol. 2009 Mar.

Abstract

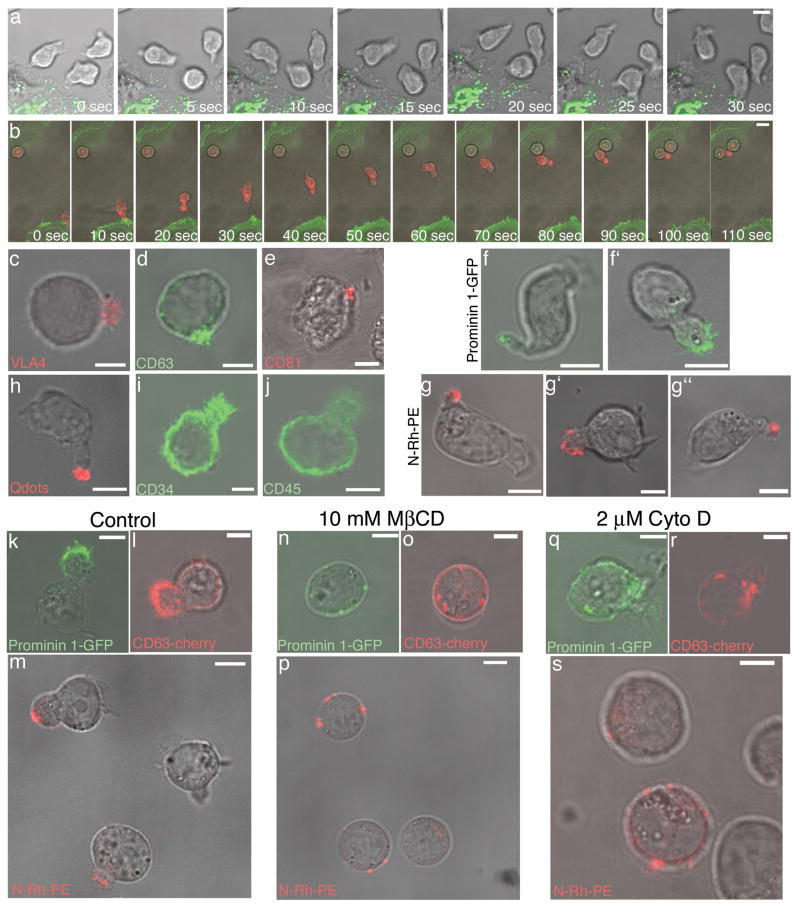
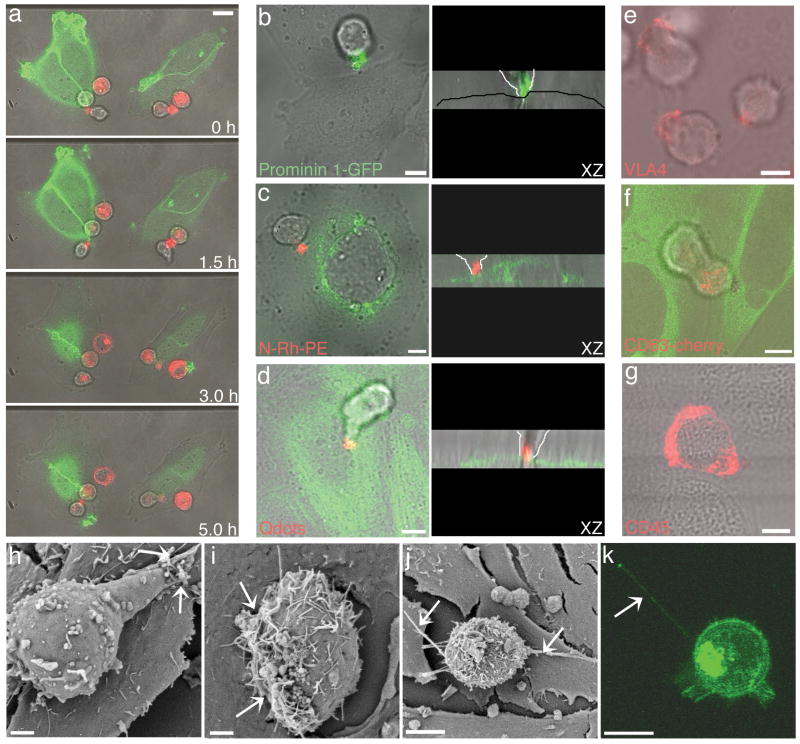
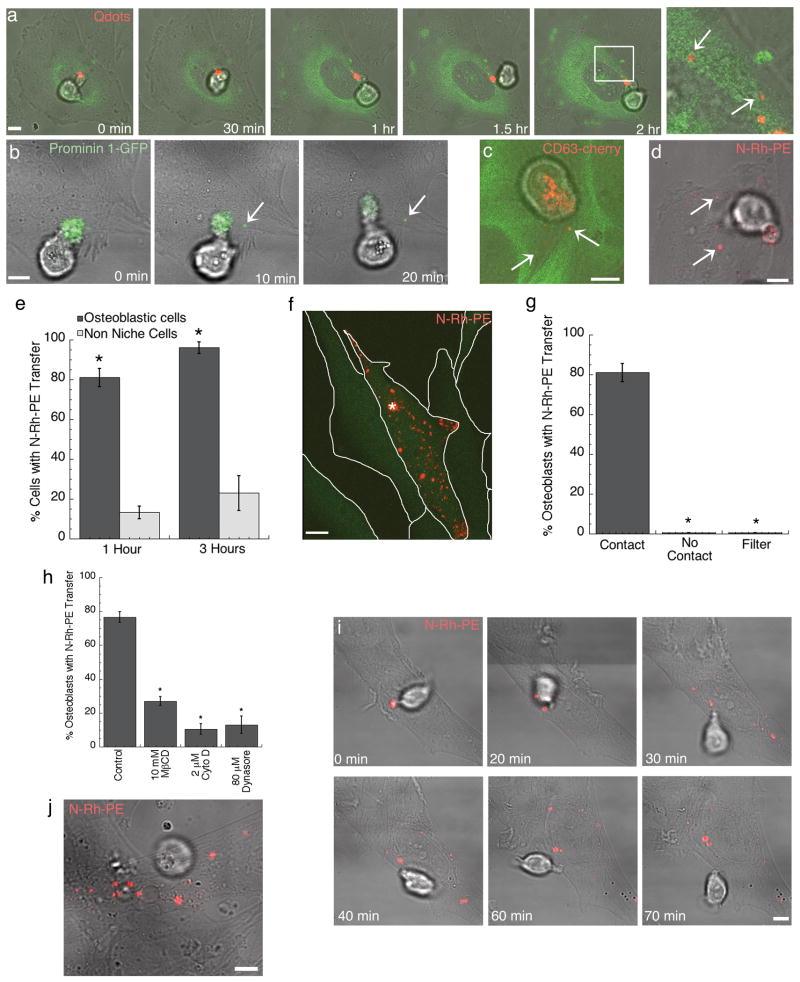
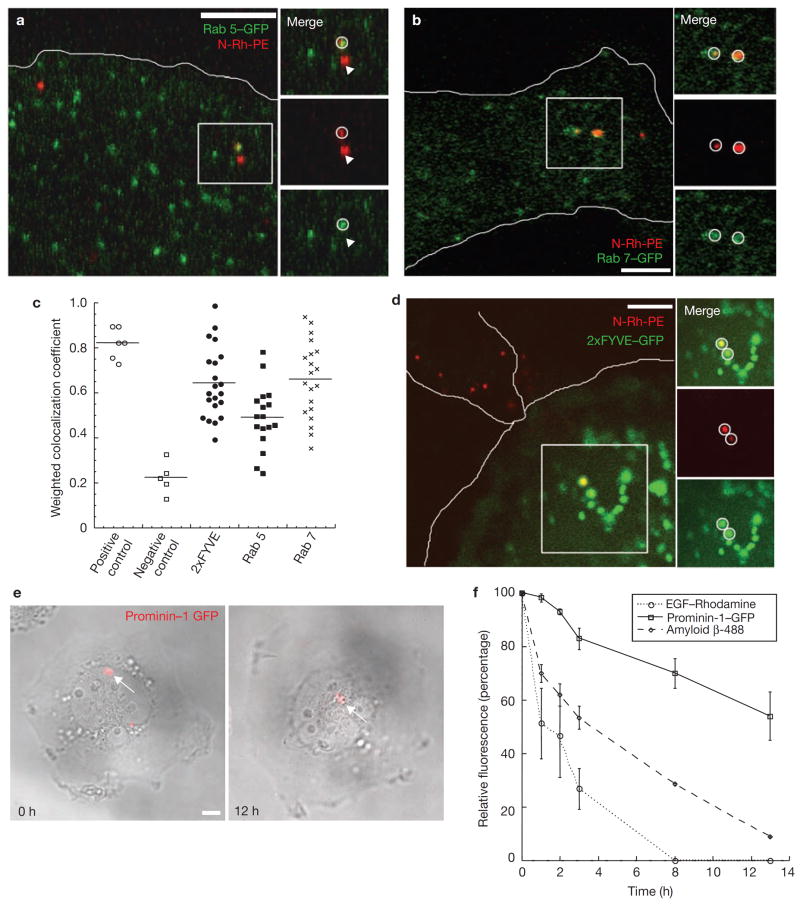
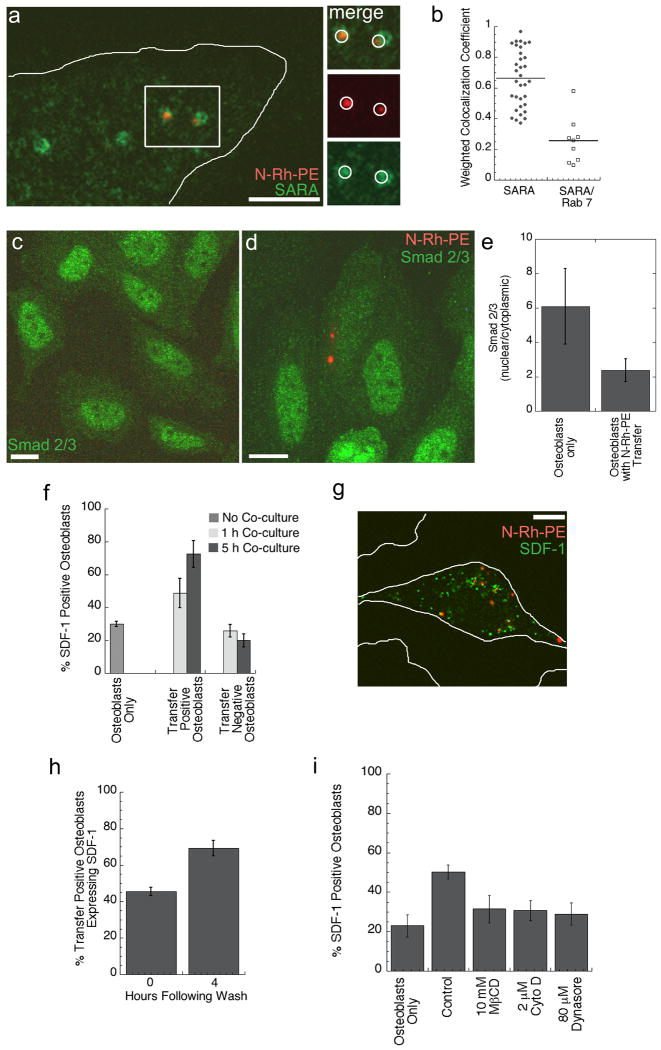
Haematopoietic stem-progenitor cells (HSPCs) reside in the bone marrow niche, where interactions with osteoblasts provide essential cues for their proliferation and survival. Here, we use live-cell imaging to characterize both the site of contact between osteoblasts and haematopoietic progenitor cells (HPCs) and events at this site that result in downstream signalling responses important for niche maintenance. HPCs made prolonged contact with the osteoblast surface through a specialized membrane domain enriched in prominin 1, CD63 and rhodamine PE. At the contact site, portions of the specialized domain containing these molecules were taken up by the osteoblast and internalized into SARA-positive signalling endosomes. This caused osteoblasts to downregulate Smad signalling and increase production of stromal-derived factor-1 (SDF-1), a chemokine responsible for HSPC homing to bone marrow. These findings identify a mechanism involving intercellular transfer to signalling endosomes for targeted regulation of signalling and remodelling events within an ex vivo osteoblastic niche.


Figures

Figure 1
Figure 1
Organization and maintenance of the HPC plasma membrane. HPC dynamics are revealed by time lapse confocal microscopy of (a) CD34+ cells co-cultured with osteoblasts stably transfected with GalT-YFP (green) or (b) KG1a cells labeled with PKH26 (red) and co-cultured with osteoblasts transiently expressing PH-Akt-GFP (green). Immunofluorescence labeling of KG1a cells with antibodies for (c) VLA4, (d) CD63, and (e) CD81 illustrates an asymmetric distribution of membrane proteins, whereas (i) CD34 and (j) CD45 are distributed more uniformly in the plasma membrane. (h) Live cell imaging of CD34+ cells labeled with cell-labeling QDs (red) (Invitrogen). Live cell microscopy of (f,g) CD34+ cells or (f′,g′) KG1a cells transiently transfected with prominin 1-GFP (green) or 24 h after N-Rh-PE labeling (red). These images are representative of the polarized molecule phenotype observed in > 100 HPCs expressing prominin 1-GFP and > 200 HPCs labeled with N-Rh-PE. Live cell microscopy of (g″) CD34+CD38- cells 24 h after N-Rh-PE labeling. Live cell microscopy of KG1a cells labeled with N-Rh-PE or transiently transfected with CD63-cherry, or prominin 1-GFP and then treated with vehicle control, (k,l,m), 10 mM methyl β cyclodextrin (MβCD) for 30 min at 37°C (n,o,p), or 2 μm cytocholasin D (Cyto D) for 1 h at 37°C (q,r,s). N-Rh-PE was polarized in 92% of the cells treated with vehicle control, 20% of the cells treated with MβCD, and 40% of the cells treated with Cyto D (n > than 100 cells/condition). Following these various drug treatments, KG1a cell viability was greater than 95% as assessed by trypan blue staining (data not shown). Scale bars - 5μm.
Figure 2
Figure 2
HPC/osteoblast contact occurs through a specialized HPC membrane domain. (a) Time-lapse microscopy of PKH26 labeled KG1a cells (red) co-cultured with osteoblasts transiently transfected with PH-Akt-GFP (green) reveals long-term adhesion of HPCs to osteoblasts. The HPC/osteoblast contact domain is enriched in various membrane molecules illustrated by (b) prominin 1-GFP transfecton of KG1a cells co-cultured with osteoblasts (representative of > 50 HPC/osteoblast contacts), (c) N-Rh-PE labeled KG1a cells (red) co-cultured with Rab7-GFP expressing osteoblasts (green) (representative of > 100 HPC/osteoblast contacts), and (d) CD34+ cells labeled with cell labeling QDs (red) co-cultured with actin-YFP expressing osteoblasts. In the corresponding XZ images, the osteoblast monlayer is outlined with a black line for the osteoblasts imaged with bright field only, and the progenitor cell contact is outlined with white lines. The enrichment of specific molecules at the cell contact site was also illustrated by (e) VLA-4 immunofluorescence staining of KG1a cells (red) co-cultured with osteoblasts and (f) live cell imaging of a KG1a cell transiently transfected with CD63-cherry (red) and co-cultured with osteoblastic cells stably transfected with tubulin-YFP (green). (g) CD45 immunofluorescence staining of CD34+ cells (red) co-cultured with osteoblastic cells displayed a uniform membrane distribution.(h-j) SEM of CD34+ cells co-cultured with osteoblastic cells for three hours. Arrows indicate the contact sites. (k) 3D projection image of a live KG1a cell transiently transfected with the wtPrP-GFP construct. The arrow indicates the membrane nanotube formed between the KG1a and an osteoblast. All scale bars – 5 μm, except (h,i) scale bars – 2 μm.
Figure 3
Figure 3
Intercellular transfer occurs between HPC and osteoblastic cells in a contact dependent manner. (a) KG1a cell labeled with QDs (red) and co-cultured with osteoblastic cells stably transfected with tubulin-YFP (green) for 2 h before live-cell imaging. The white box indicates the zoomed region and arrows indicate transferred QDs internalized within the osteoblasts. KG1a cells transiently transfected with (b) prominin1-GFP (green) or (c) CD63-cherry (red) and co-cultured with osteoblasts for one hour before live cell confocal imaging. Arrows indicate transferred protein. CD63-cherry transfected cells were co-cultured with osteoblasts stably transfected with tubulin-YFP (green). (d) Live-cell confocal microscopy of N-Rh-PE (red) transfer from KG1a cells to osteoblastic cells. Arrows indicate transferred lipid. (e) The percentage of osteoblastic cells (black, n=120) or HeLa cells (grey, n=75) that acquired N-Rh-PE transfer following contact with an N-Rh-PE labeled HPC after either 1 or 3 h of co-culture. (n, number of HPC/osteoblast or HPC/Hela contacted cells scored over three independent experiments). (f) Live cell imaging of N-Rh-PE (red) labeled CD34+ cell contacting an osteoblastic cell stably transfected with GFP (green). The asterisk indicates the site of CD34+ cell contact and the white lines outline the osteoblasts in the field of view. (g) The percentage of osteoblastic cells that acquired N-Rh-PE transfer following: direct contact with an N-Rh-PE labeled HPC, no contact with a labeled HPC (osteoblasts neighboring HPC contacted cells), or labeled HPC co-culture with osteoblasts through a 0.4μm membrane filter. (n > 100 osteoblasts for each condition). (h) The percentage of osteoblastic cells that acquired N-Rh-PE transfer following contact with a labeled HPC treated with control, 10 mM methyl β cyclodextrin (MβCD), 2 μm cytocholasin D (Cyto D), or 80 μm Dynasore (n > 100 for each condition). (n, number of HPC/osteoblast contacted cells counted over three independent experiments). (i) Live cell confocal microscopy of CD34+ cells labeled with N-Rh-PE and co-cultured with osteoblastic cells. Cells were co-cultured for 1 h before imaging began and intercellular transfer was observed. (j) Live cell confocal microscopy of CD34+CD38- cells labeled with N-Rh-PE and co-cultured with primary human osteoblasts. Scale bars – 5μm.
Figure 4
Figure 4
Transferred molecules are detected within various endocytic compartments of the osteoblasts. Live cell microscopy of N-Rh-PE (red) labeled KG1a cells co-cultured with osteoblastic cells transiently transfected with (a) Rab 5-GFP (green) or (b) Rab 7-GFP (green). White circles indicate transferred N-Rh-PE localized to a Rab 5-GFP or a Rab 7-GFP positive vesicle. Arrows indicate transferred N-Rh-PE not present in a Rab 5- or Rab 7-GFP vesicle. The osteoblast edge is outlined in white. (c) Histogram of weighted co-localization coefficients. As a positive control for a weighted co-localization coefficient, osteoblasts were transfected with EEA1-YFP and immunostained with an EEA-1 antibody (positive control, n = 6 cells). For a negative control, osteoblasts were transiently transfected with clathrin light chain-YFP and co-cultured with KG1a cells labeled with N-Rh-PE to allow for transfer. Weighted co-localization coefficients were calculated three hours following transfer of N-Rh-PE (negative control, n = 6 cells). All other co-localization coefficients were calculated following 1 h of co-culture (n = 20 cells for each condition). (d) Live cell microscopy of N-Rh-PE (red) labeled KG1a cells co-cultured with osteoblastic cells transiently transfected with 2xFYVE-GFP (green). White circles indicate transferred N-Rh-PE localized to a 2xFYVE-GFP positive vesicle. Both the KG1a cell and the contacted osteoblast are outlined in white. (e) Live-cell confocal imaging of osteoblasts following prominin 1-GFP (red) transfer from a transiently transfected KG1a cell. Before imaging, osteoblasts were washed with fresh medium to remove all KG1a cells, so only transferred prominin 1-GFP was detected. (f) Quantification of the relative fluorescence intensities over the course of 12 h for transferred prominin 1-GFP (solid line, n = 3 cells), internalized soluble amyloid beta-488 (dashed line, n = 6 cells), and internalized rhodamine-EGF (dotted line, n = 6 cells). Scale bars – 5μm.
Figure 5
Figure 5
Intercellular transfer correlates with decreased Smad 2/3 activation and an increased production of SDF-1 by the osteoblast. (a) N-Rh-PE (red) labeled KG1a cells were co-cultured for one hour with osteoblasts, which were then fixed and immunostained for SARA (green). Transferred N-Rh-PE could be detected within SARA positive vesicles in the osteoblast as indicated by the white circles. (b) Histogram of weighted co-localization coefficients for N-Rh-PE with a SARA positive endosome (n = 33 cells) and for SARA with Rab 7-GFP positive endosomes (n = 9 cells) indicates that transferred N-Rh-PE is detected within SARA positive endosomes, which are distinct from a Rab 7-GFP compartment. (c) Osteoblasts fixed and stained for Smad2/3 (green) have a high level of nuclear expression indicating activate Smad2/3. Following a transfer event, osteoblasts with detectable transfer (d) have a reduced nuclear localization of Smad2/3. The nuclear to cytoplasmic ratios of Smad2/3 signal intensity is quantified in (e). n > 50 osteoblasts +/- transfer. (f) Quantification of the percent of SDF-1 expressing osteoblasts without co-culture, following 1 h of co-culture, and 5 h of co-culture. (n > 100 osteoblasts or +/- transfer scored for 3 independent experiments). (g) SDF-1 immunofluorescence of a transfer positive osteoblast. White lines outline the osteoblasts in the field of view. (h) Osteoblasts were co-cultured with N-Rh-PE labeled KG1a cells for 1 h and then washed to remove all KG1a cells. SDF-1 expression was detected by immunofluorescence immediately following KG1a cell removal and then 4 h following KG1a cell removal. (n > 100 transfer positive osteoblasts for 3 independent experiments). (i) To evaluate whether transfer rather than KG1a cell contact mediated the increase in SDF-1 expression, KG1a/osteoblast co-cultures were treated with 10 mM methyl β cyclodextrin (MβCD), 2 μm cytocholasin D (Cyto D), or 80 μm Dynasore to allow for KG1a cell contact with osteoblasts, but not transfer. Drug treatment, which reduced N-Rh-PE transfer (Fig. 3h), but allowed for cell contact, resulted in a decreased percent of SDF-1 expressing osteoblasts when compared to control co-cultures. (n > 600 osteoblasts for 3 independent experiments)

Comment in

References

    1. Adams GB, Scadden DT. The hematopoietic stem cell in its place. Nat Immunol. 2006;7(4):333–7. - PubMed
    1. Wright DE, et al. Physiological migration of hematopoietic stem and progenitor cells. Science. 2001;294(5548):1933–6. - PubMed
    1. Mendez-Ferrer S, et al. Haematopoietic stem cell release is regulated by circadian oscillations. Nature. 2008;452(07186):442–8. - PubMed
    1. Jung Y, et al. Cell-to-cell contact is critical for the survival of hematopoietic progenitor cells on osteoblasts. Cytokine. 2005;32(3-4):155–62. - PubMed
    1. Zhang J, et al. Identification of the haematopoietic stem cell niche and control of the niche size. Nature. 2003;425(6960):836–41. - PubMed

Publication types