Comparative Study
. 2009 Mar;12(3):286-94.
doi: 10.1038/nn.2265. Epub 2009 Feb 8.

Slow glycinergic transmission mediated by transmitter pooling

Affiliations
Comparative Study

Slow glycinergic transmission mediated by transmitter pooling

Veeramuthu Balakrishnan et al. Nat Neurosci. 2009 Mar.

Abstract

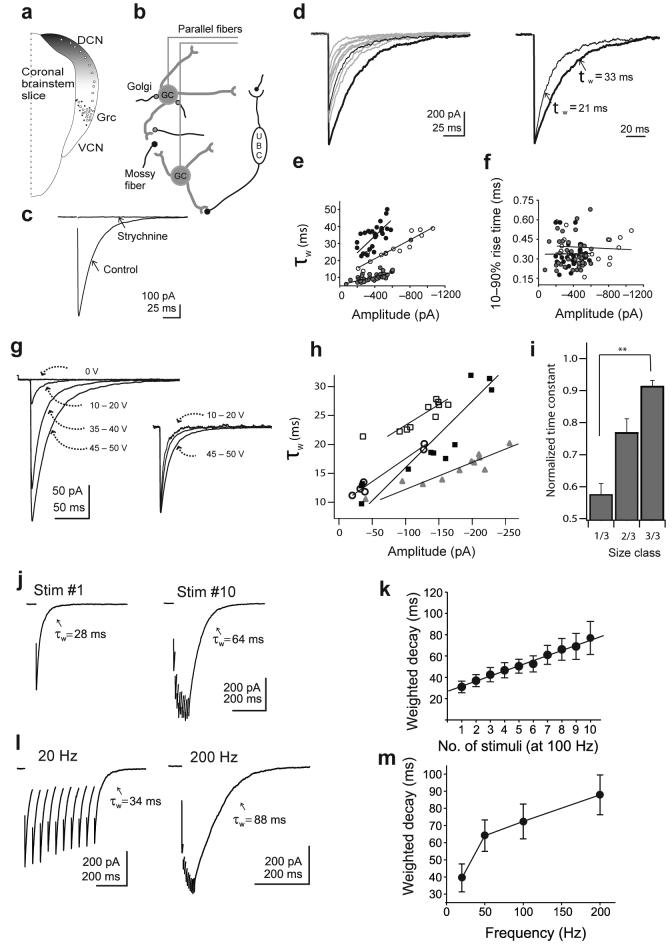
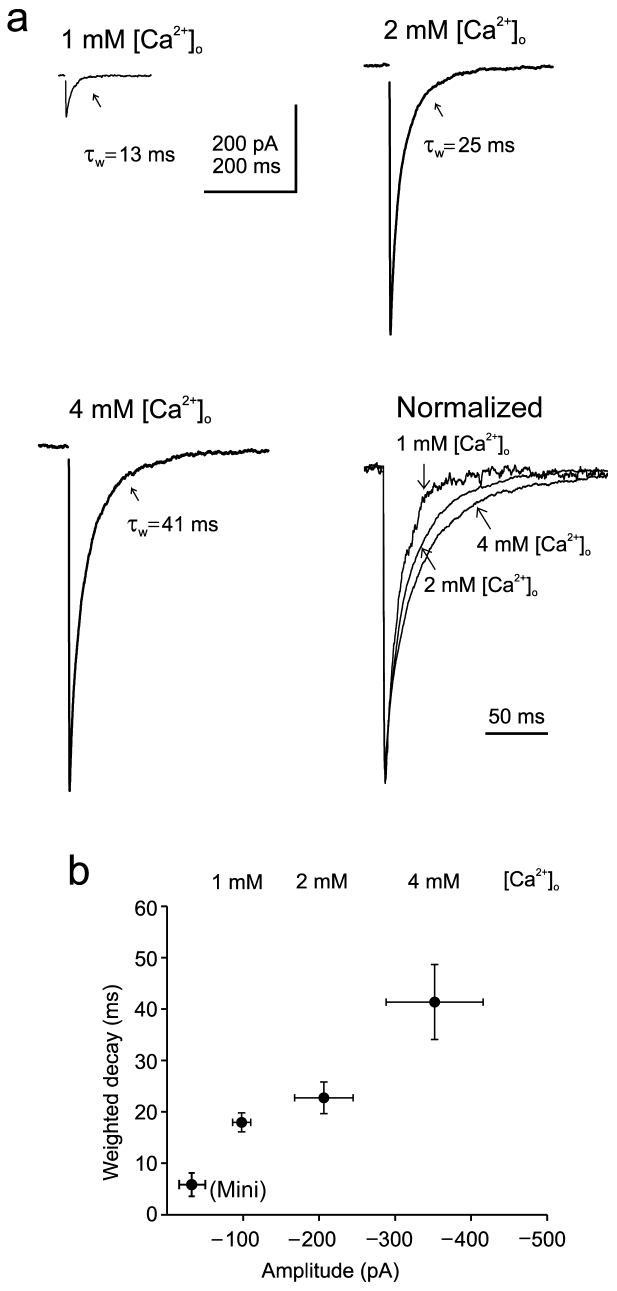
Most fast-acting neurotransmitters are rapidly cleared from synaptic regions. This feature isolates synaptic sites, rendering the time course of synaptic responses independent of the number of active synapses. We found an exception at glycinergic synapses on granule cells of the rat dorsal cochlear nucleus. Here the duration of inhibitory postsynaptic currents (IPSCs) was dependent on the number of presynaptic axons that were stimulated and on the number of vesicles that were released from each axon. Increasing the stimulus number or frequency, or blocking glycine uptake, slowed synaptic decays, whereas a low-affinity competitive antagonist of glycine receptors (GlyRs) accelerated IPSC decay. These effects could be explained by unique features of GlyRs that are activated by pooling of glycine across synapses. Functionally, increasing the number of IPSPs markedly lengthened the period of spike inhibition following the cessation of presynaptic stimulation. Thus, temporal properties of inhibition can be controlled by activity levels in multiple presynaptic cells or by adjusting release probability at individual synapses.


Figures

Figure 1
Figure 1. Granule cells in the dorsal cochlear nucleus (DCN) and their glycinergic postsynaptic currents
(a) Schematic representation of the cochlear nucleus in a coronal brainstem slice, showing the distribution of granule cells (circles) in the DCN and the granule cell region (Grc). (b) Synaptic inputs to granule cells. Granule cells receive excitatory inputs through mossy fibers and the unipolar brush cells (UBC). Inhibitory inputs are assumed to be from the Golgi/stellate neurons. (c) Averaged glycinergic IPSC from a granule cell under control conditions and in 0.5 μM strychnine application. (d) Example traces of glycinergic IPSCs upon synaptic stimulation. Two sample IPSCs of different size are shown in thick and thin black lines. On the right, these IPSCs were normalized and their corresponding weighted decay times are shown. (e) The weighted decay constants of the IPSCs positively correlated with the amplitude. Plot show the values from three cells and their corresponding regression line. The linear fits in the three plots have r=0.92, 0.68 and 0.76 with P<0.0001 for all. (f) IPSC rise times and amplitudes had no correlation. The values from three cells, plotted as rise time and amplitude. Linear fits are insignificant for all cells. (g) Example IPSCs evoked at various voltages. The inset shows the traces normalized, revealing that responses to smaller stimuli decay more quickly. (h) Correlation of amplitude and weighted decay as stimulus strength was changed in four neurons. Correlation coefficients were 0.88, 0.91, 0.93, 0.99 (P<0.002). (i) Normalized amplitudes of responses were grouped into upper, middle, and lower thirds of the population, and their corresponding decay times averaged (9 cells, 15-36 measurements/category, P<0.002 between categories). (j) Examples of glycinergic IPSCs evoked with one and ten stimuli (10 ms interval). (k) Weighted decay times of the IPSCs against number of stimuli (100 Hz) from five cells. (l) Ten IPSCs delivered at 20 Hz and 200 Hz. (m) Weighted decay times from 7 cells at different frequencies. Comparison of decay times at different frequencies: 20-50 Hz; P<0.01, 50-100 Hz; P<0.05, 100-200 Hz; P < 0.001). Error bars are ±SEM.
Figure 2
Figure 2. Asynchronous release
(a) Evoked responses in 2 mM Ca2+ and 8 mM Sr2+. (b) Response to 10 stimuli (100 Hz) in 2 mM Ca2+ and 8 mM Sr2+. In all cases asynchronous release events are clearly visible. Black trace highlights one of 25-51 in each panel. All data shown are from one cell. (c) Averaged delayed release IPSC from data shown in a-b. (d) Decay time constant for delayed release events (‘mini’), and response to single stimuli or trains of 10 shocks at 100 Hz. Rise time of quanta and evoked responses were not significantly different. Asterisk: P<0.01. n=5 cells. (e) Simulated quantal current (34 pA* −(1−exp−t/0.4ms)2*(exp−t/8ms)) and an unaveraged trace showing response to a single stimulus and to a train of 10 stimuli delivered at 100 Hz. (f) Deconvolved release rate from traces in panel e. (g) Ten low-noise traces from one cell showing response to single and train of 10 stimuli. Average of 64 such traces is superimposed in black (decay times were 38 ms and 89 ms for single and train response). (h) Same sweeps as in panel g, shown at higher gain to illustrate single-channel currents. Error bars are ±SEM.
Figure 3
Figure 3. Increasing release probability slows IPSC decay time
(a) Averaged glycinergic IPSCs recorded in different bath Ca2+ concentrations. Corresponding weighted decay constants are also shown. (b) Relation between amplitude and decay time in three Ca2+ concentrations, as indicated (n=5 cells). In lower left are the mean amplitude and decay time for delayed release events (‘mini’) for 5 cells. Error bars are ±SEM.
Figure 4
Figure 4. Probing multivesicular release and receptor saturation using a weak antagonist of GlyRs, SR-95531
(a) Block of IPSC by 300 μM SR-95531 (SR). (b) Percent reduction in IPSC amplitude by 300 μM SR-95531 in different Ca2+ concentrations. 4-9 cells per point. Values for 1 and 2 mM Ca2+ are significantly different (P<0.05). (c) SR-95531 inhibition of responses to a train of 10 IPSCs at 100 Hz. (d) Traces in (c) were normalized to the first IPSC in the train. Amplitudes of later IPSCs in the train were measured from the foot to peak, as indicated. Traces are averages of 20 trials. (e) Summary of the peak amplitudes of the last five IPSCs in a train in control and in the presence of SR-95531 for 10 experiments in which the amplitudes were normalized to first IPSC. A comparison of the responses in control and SR-95531 revealed that there was a significant increase in the relative amplitude of later IPSCs (P < 0.0015, paired t-test) indicating that SR-95531 relieves saturation during high-frequency trains. Error bars are ±SEM.
Figure 5
Figure 5. SR-95531 accelerates the decay of IPSCs
(a) Example of averaged and (b) normalized glycinergic IPSCs upon single stimulation in control and in the presence of 300 μM SR-95531. (c) Example of averaged and normalized (d) traces with and without 200 nM strychnine. (e,f) Effect of SR-95531 (SR) and strychnine (STR) on weighted decay time. Paired t-tests were significant only for the SR-95531 trials (P<0.003).
Figure 6
Figure 6. Simulation of IPSCs
(a) The glycine transient had a peak of 6 mM and fast decay constant of 80 μs. Inset shows the same traces but different scale to illustrate two slow decay constants, of 5 ms and 60 ms, used in the simulation. These transients were then used to drive the GlyR model of Burzomato et al (2004) (see Supplemental Materials for details), and the resulting traces are shown below. The weighted decay times of these were 8.3 and 16.6 ms. (b) The transient with the 60-ms slow decay constant was used to create the response to 10 stimuli at 100 Hz, resulting in a large buildup of transmitter. The resulting IPSC decayed with a 49.9 ms decay constant. The gray trace is the scaled response to the single stimulus shown in (a). (c) The glycine transient in (a) was scaled by 0.5 or 2 to simulate an increase or decrease in multivesicular release. Such changes alter peak synaptic responses (indicating that receptors are not saturated by one vesicle) but also change synaptic current decay time. (d) Simulation of IPSCs with the 60 ms slow decay constants and the effects of 300 μM SR-95531. The antagonist both inhibited the IPSC and accelerated its decay. See Supplemental Materials for implementation of antagonist model and further simulations.
Figure 7
Figure 7. Contribution of IPSC decay time to the duration of inhibition
(a) Example traces showing the duration of inhibition by a single and a train (10 shocks, 100 Hz) of synaptically evoked IPSPs on the granule cell spiking. Black lines at top mark period of the stimuli. Red highlights a single sweep. (b) Traces from panel a are overlaid at time of last stimulus. (c) Period between time of last synaptic stimulus and resumption of action potential firing, for single and trains of IPSPs. The latency before spiking resumed increased significantly following a train of IPSPs (n=8; P < 0.0015). (d) Relation between peak of negative peak of IPSP and latency to spike firing for three cells. Latency increases sharply with larger IPSPs, consistent with longer lasting synaptic conductance. (e) Example traces in which firing was interrupted by negative current steps (marked by brackets) of different amplitude (range −5 to −50 pA) for 10 ms (left sweeps) or 100 ms (right sweeps). (f) Example of overlaid responses at termination of 10 and 100 ms current pulses that hyperpolarized the neuron to a potential near −80 mV. (g) Latency to spike firing after 10- and 100-ms pulses for IPSPs reaching near −80 mV (−75 mV to −82 mV). (h) Relation between most negative point of hyperpolarization and the resulting latency to firing for six cells. These data show a sublinear relation between voltage and latency suggesting a maximal repriming of A-type K+ current. Error bars are ±SEM.
Figure 8
Figure 8. Glycinergic nerve terminal density is consistent with spillover-mediated transmission
(a), EGFP fluorescence in a region of DCN in tissue from a transgenic mouse expressing EGFP in glycinergic neurons. (b), a rhodamine-filled granule cell in the same region as (a). (c), anti-VIAAT antibody signal in the same location as (a) and (b). (d), merged image of (a-c). Regions of overlapping EGFP and VIAAT expression (yellow) were assumed to be glycinergic nerve terminals. (e,f), sample images used for analysis of glycine nerve terminal density from the lower and upper boxed regions in (d), respectively. Yellow regions show colocalized EGFP and VIAAT expression determined by overlaying thresholded EGFP and VIAAT signals (see Methods). The rhodamine-filled granule cell is shown in blue. All images are collapsed stacks of ten adjacent confocal sections acquired 0.2 μm apart in the z-axis. Scale bar in (c) (10 μm) applies to (a-c). Scale bar in (d), 10 μm. Scale bar in (f) (2 μm) applies to (e,f). (g) uniform terminal array in 10 μm cube. Terminals printed in different colors for clarity. (h), Spillover glycine transient (black) summed over all terminals and measured at cube center (black spot in (g)). Red trace is current response to this transient predicted by receptor model. (i), Response of kinetic model (black traces) to fast glycine transient (6 mM peak, 80 usec fast decay, 5 ms-15 μM slow component), to the sum of the fast transient plus the slow transient in panel (h), and a sample IPSC trace (grey). Weighted time constants of these 3 traces were 8.7 ms, 15 ms, and 15 ms, respectively.

References

    1. Katz B, Miledi R. The binding of acetylcholine to receptors and its removal from the synaptic cleft. J Physiol. 1973;231:549–574. - PMC - PubMed
    1. Barrett EF, Stevens CF. The kinetics of transmitter release at the frog neuromuscular junction. J Physiol. 1972;227:691–708. - PMC - PubMed
    1. Barbour B, Keller BU, Llano I, Marty A. Prolonged presence of glutamate during excitatory synaptic transmission to cerebellar Purkinje cells. Neuron. 1994;12:1331–1343. - PubMed
    1. Jones MV, Westbrook GL. Desensitized states prolong GABAA channel responses to brief agonist pulses. Neuron. 1995;15:181–191. - PubMed
    1. Legendre P. A reluctant gating mode of glycine receptor channels determines the time course of inhibitory miniature synaptic events in zebrafish hindbrain neurons. J Neurosci. 1998;18:2856–2870. - PMC - PubMed

Publication types

MeSH terms