. 2009;4(2):e4417.
doi: 10.1371/journal.pone.0004417. Epub 2009 Feb 9.

Putative nanobacteria represent physiological remnants and culture by-products of normal calcium homeostasis

Affiliations

Putative nanobacteria represent physiological remnants and culture by-products of normal calcium homeostasis

John D Young et al. PLoS One. 2009.

Abstract

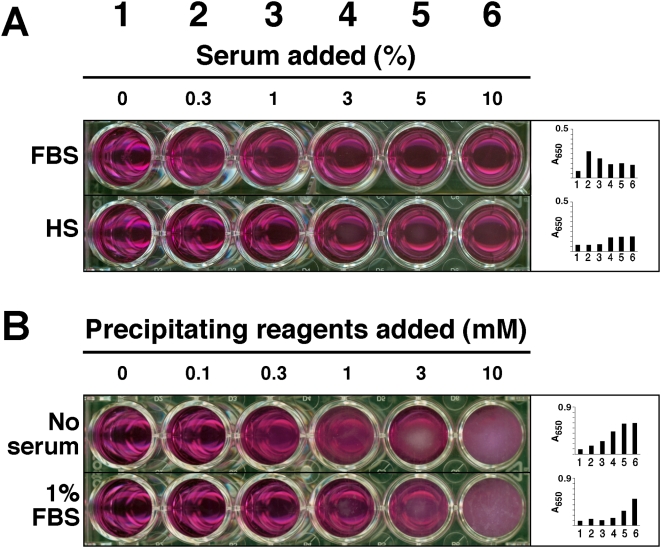
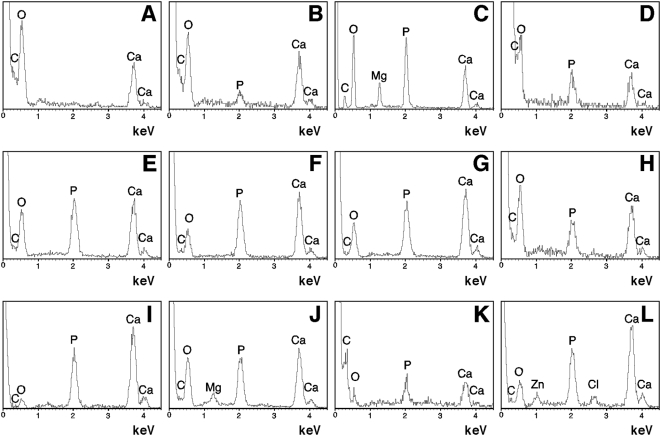
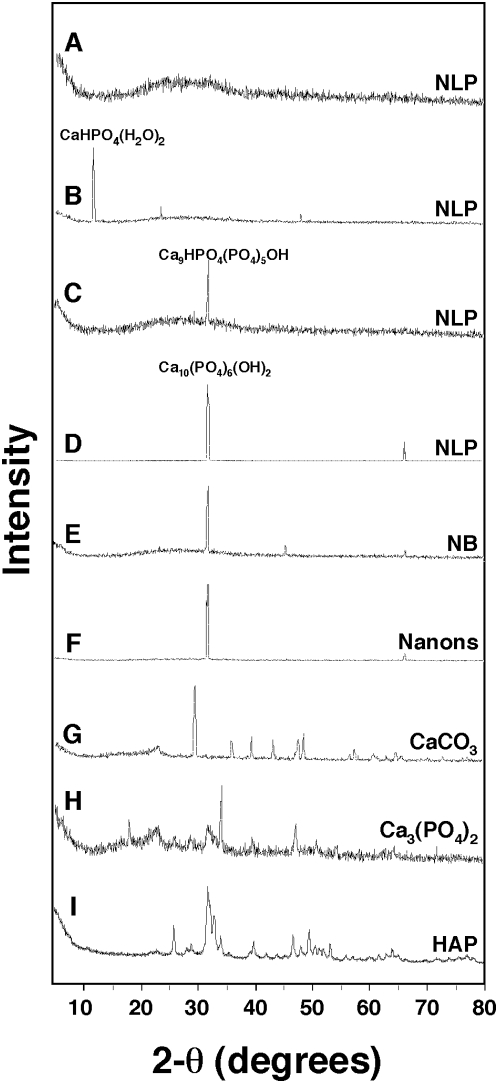
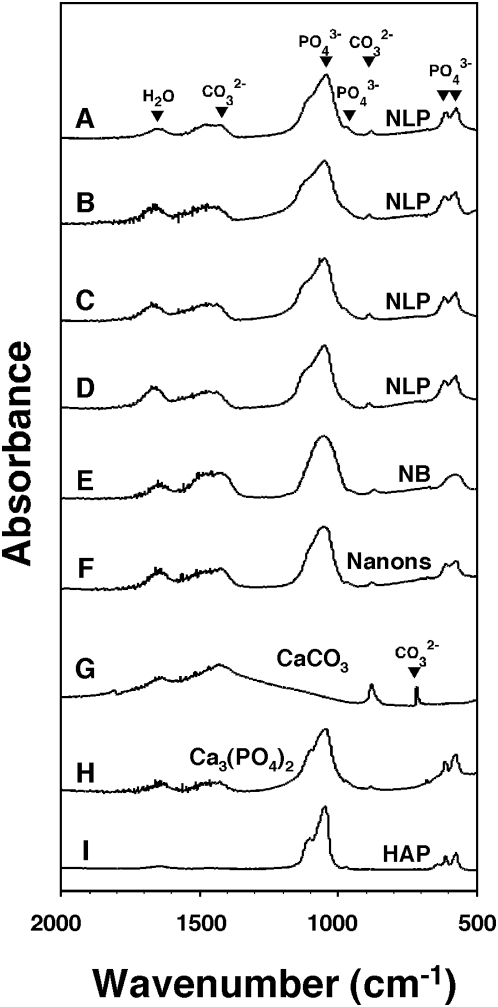
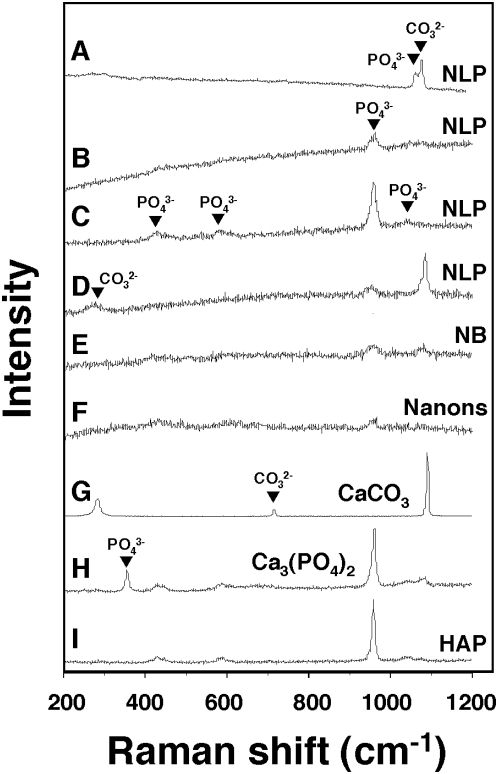
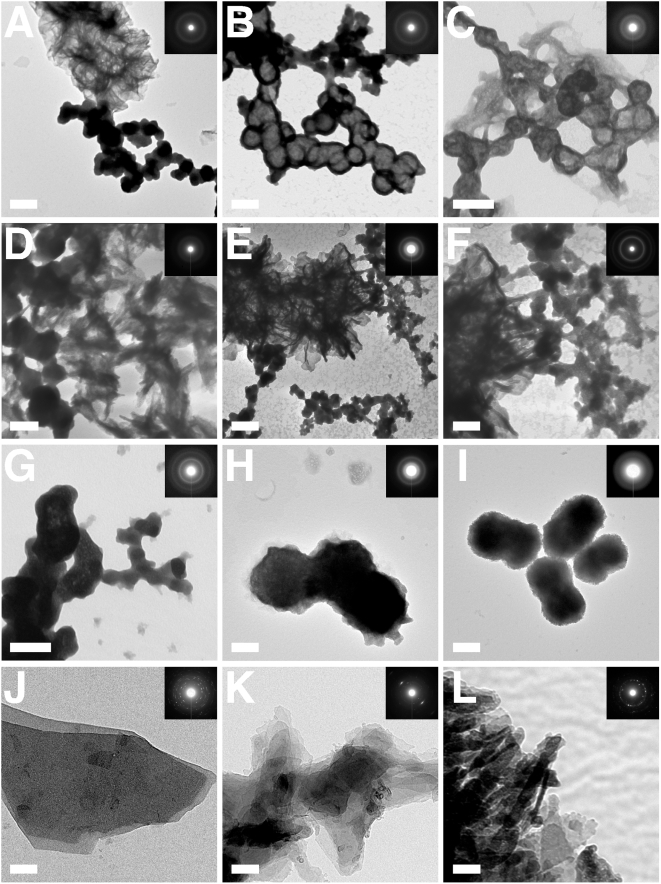
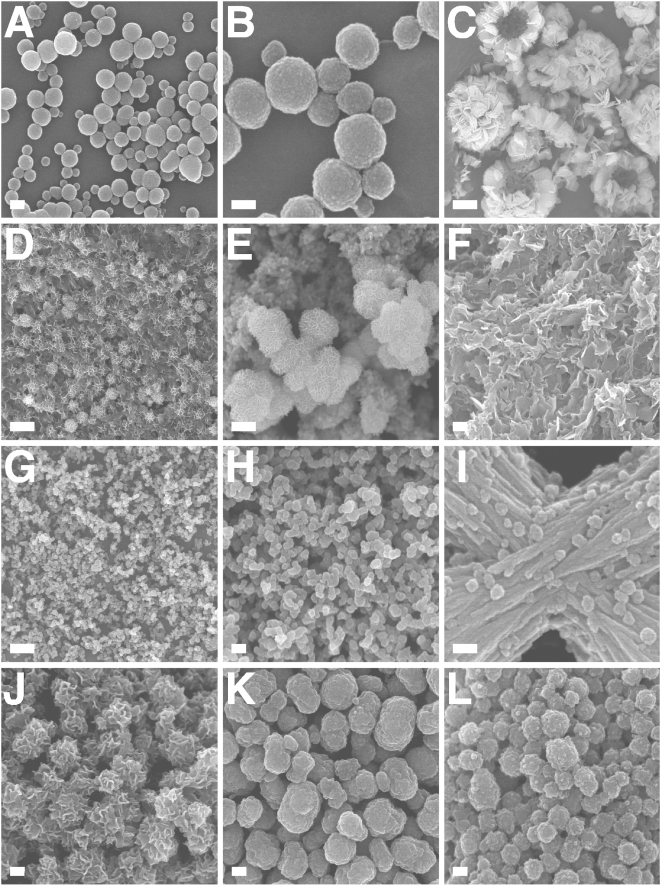
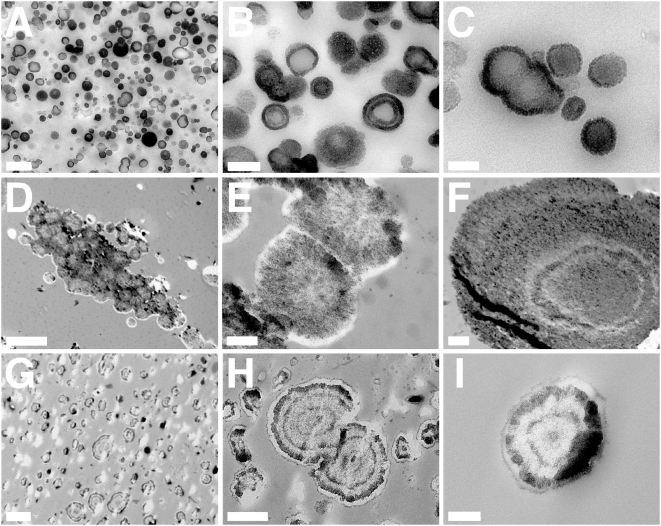
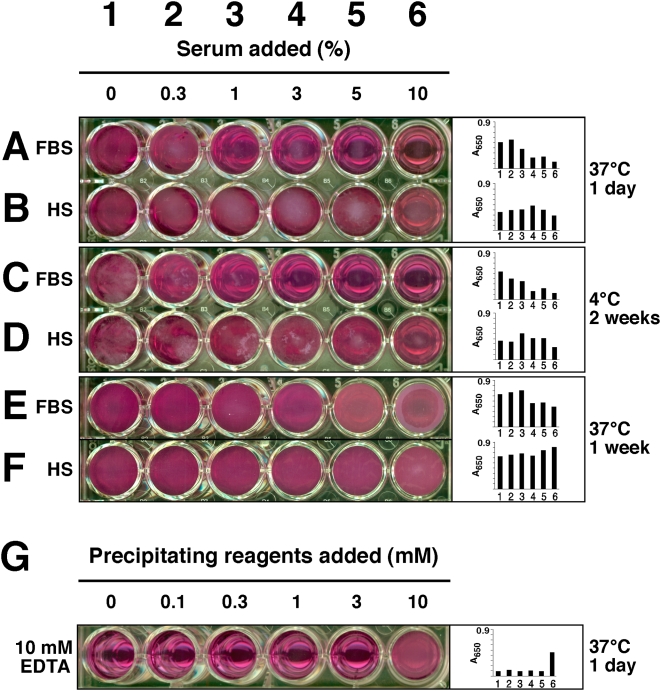
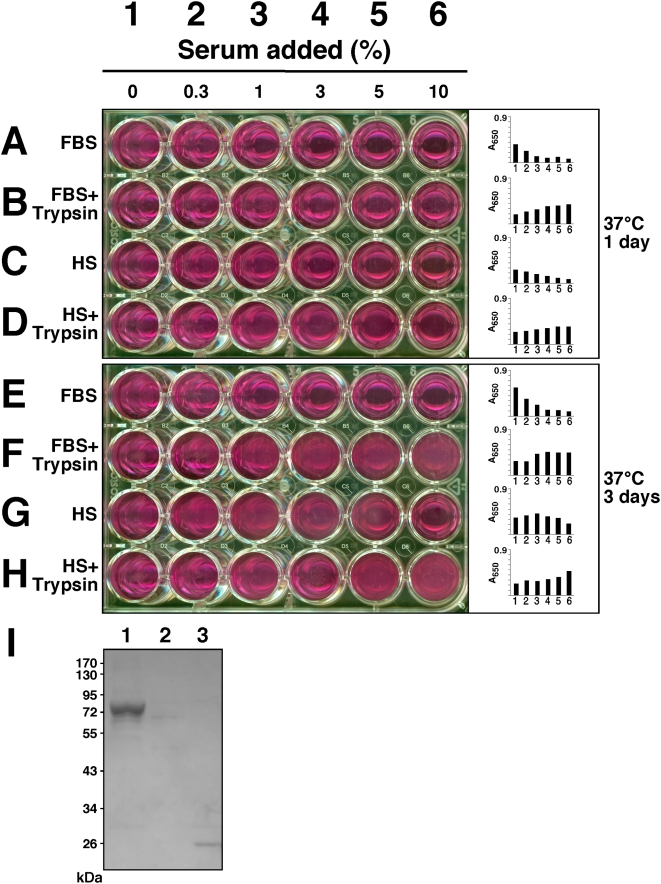
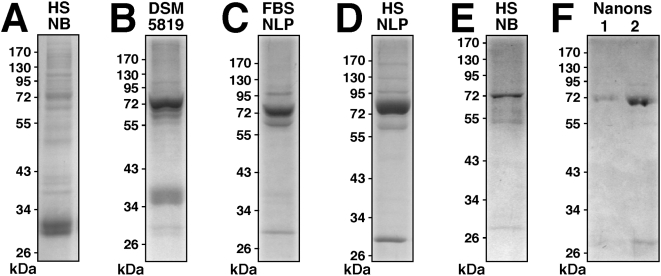
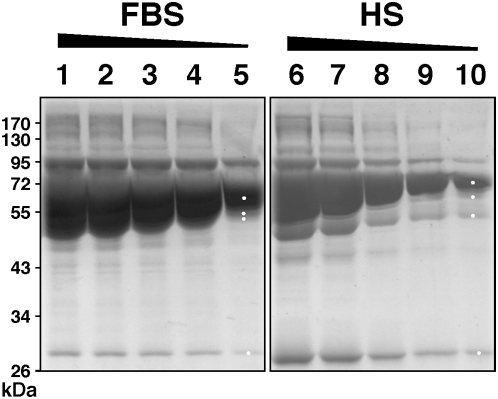
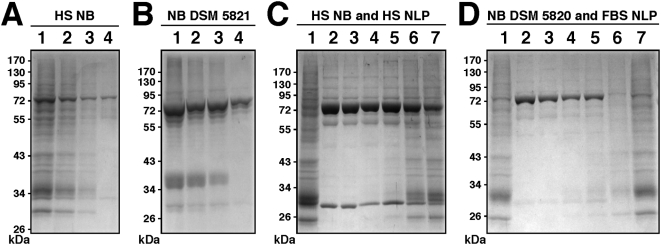
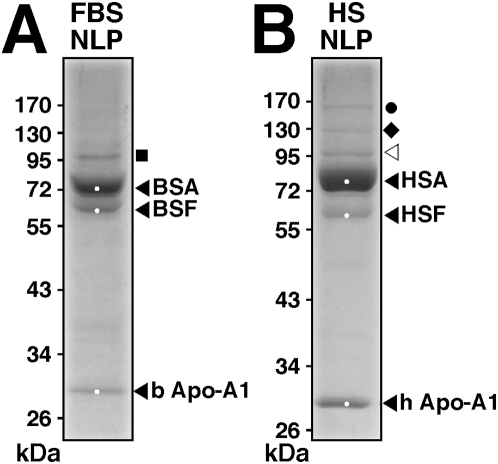
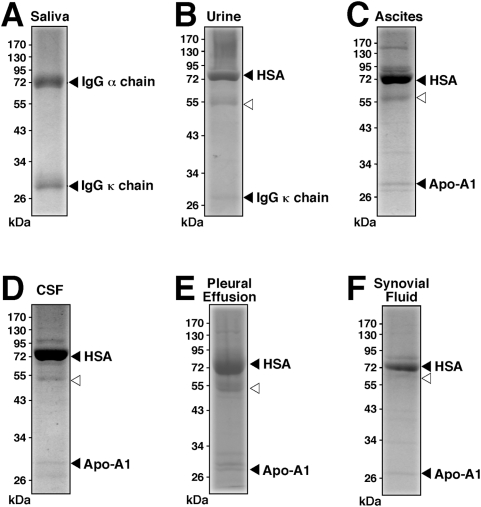
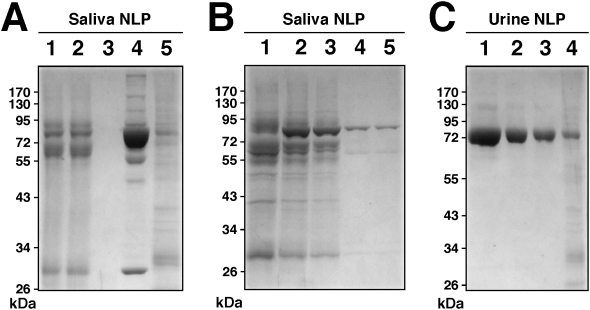
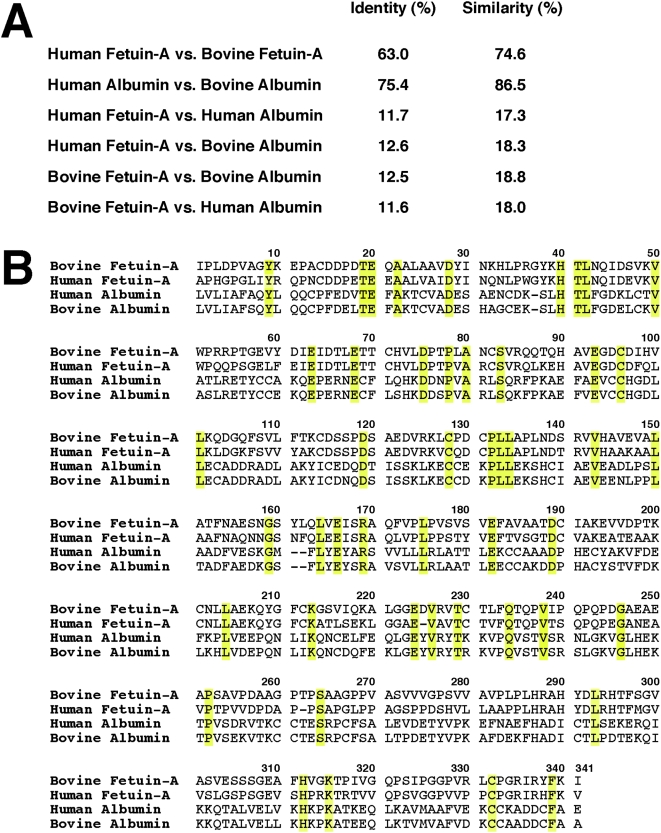
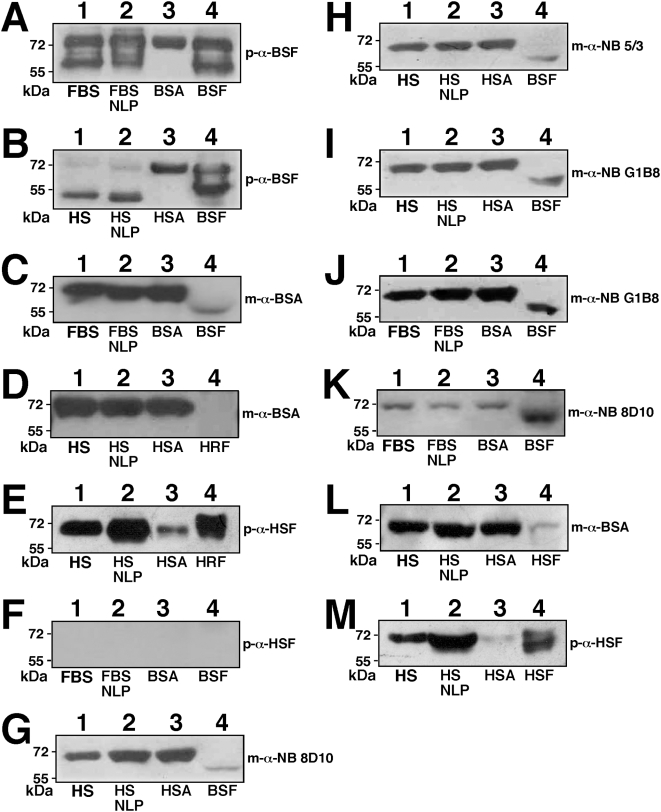
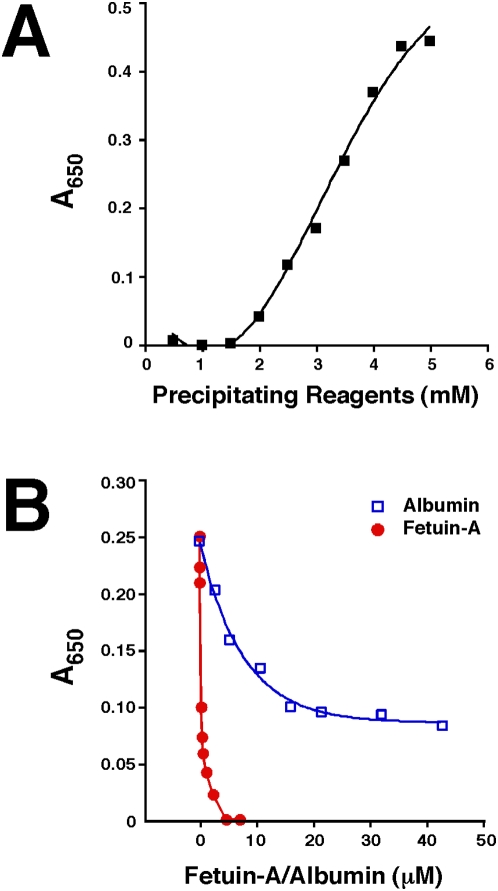
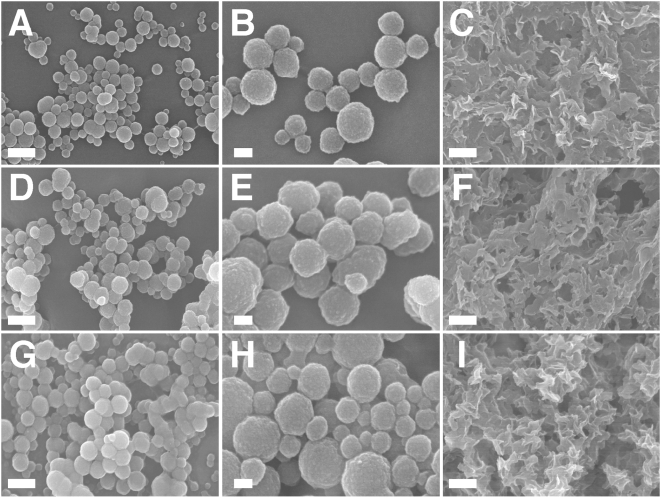
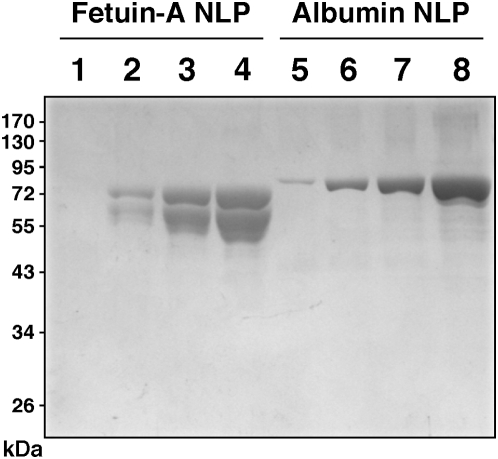
Putative living entities called nanobacteria (NB) are unusual for their small sizes (50-500 nm), pleomorphic nature, and accumulation of hydroxyapatite (HAP), and have been implicated in numerous diseases involving extraskeletal calcification. By adding precipitating ions to cell culture medium containing serum, mineral nanoparticles are generated that are morphologically and chemically identical to the so-called NB. These nanoparticles are shown here to be formed of amorphous mineral complexes containing calcium as well as other ions like carbonate, which then rapidly acquire phosphate, forming HAP. The main constituent proteins of serum-derived NB are albumin, fetuin-A, and apolipoprotein A1, but their involvement appears circumstantial since so-called NB from different body fluids harbor other proteins. Accordingly, by passage through various culture media, the protein composition of these particles can be modulated. Immunoblotting experiments reveal that antibodies deemed specific for NB react in fact with either albumin, fetuin-A, or both, indicating that previous studies using these reagents may have detected these serum proteins from the same as well as different species, with human tissue nanoparticles presumably absorbing bovine serum antigens from the culture medium. Both fetal bovine serum and human serum, used earlier by other investigators as sources of NB, paradoxically inhibit the formation of these entities, and this inhibition is trypsin-sensitive, indicating a role for proteins in this inhibitory process. Fetuin-A, and to a lesser degree albumin, inhibit nanoparticle formation, an inhibition that is overcome with time, ending with formation of the so-called NB. Together, these data demonstrate that NB are most likely formed by calcium or apatite crystallization inhibitors that are somehow overwhelmed by excess calcium or calcium phosphate found in culture medium or in body fluids, thereby becoming seeds for calcification. The structures described earlier as NB may thus represent remnants and by-products of physiological mechanisms used for calcium homeostasis, a concept which explains the vast body of NB literature as well as explains the true origin of NB as lifeless protein-mineralo entities with questionable role in pathogenesis.


Conflict of interest statement

Competing Interests: The authors have declared that no competing interests exist.

Figures

Figure 1
Figure 1. Culture of NB from serum and formation of NLP.
(A) Culture of NB from FBS (top panel) and HS (bottom panel). Serum was inoculated into DMEM to the indicated concentrations. After incubating for 1 month at 37°C, NB were detected by visual inspection and A650 (insets). For FBS, the amount of NB was maximal at 0.3%, decreasing thereafter with higher FBS concentrations, while for HS, NB were only visually noticeable at HS concentrations exceeding 3%. (B) Formation of NLP in DMEM. NLP were prepared by successively adding solutions of 0.25 M CaCl2, Na2CO3, and NaH2PO4 (pH 7.4) into DMEM as indicated and incubated at 37°C overnight, which resulted in dose-dependent formation of NLP (top row). The same experiment was repeated in the presence of 1% FBS, which showed inhibition of NLP formation (bottom row). This serum inhibition was overcome by increased concentrations of precipitating reagents, at 3 mM and above.
Figure 2
Figure 2. Energy-dispersive X-ray spectroscopy of NLP and NB.
EDX results were selected to illustrate the wide spectrum of NLP compositions, with respect to the amounts of calcium and phosphorus incorporated, and their similarities to NB. (A) Elemental composition of NLP prepared by adding CaCl2 and (NH4)2CO3 at 50 mM into DMEM corresponding to calcium carbonate. (B and C) Amorphous CaCO3 NLP produced as in (A) except that the precipitating reagents were added to DMEM and incubated at room temperature for 2 days (B) or one month (C), showing increased incorporation of P with prolonged incubation. Ca/P ratios are 5.09 for (B) and 1.60 for (C), with the latter close to the theoretical value of 1.67 associated with stoichiometric HAP. (D–H) Formation of NLP with various inputs of ions, including P, yielding different Ca/P ratios. (D) NLP formed from 0.25 M each of CaCl2, Na2CO3, and NaH2PO4, mixed in with DMEM at vol. ratios of 2∶5∶5∶13 that had been incubated in DMEM for 2 days, revealing the presence of magnesium ions and a Ca/P ratio of 0.78. (E–H) NLP were prepared like in (D) at vol. ratios of (E) 1∶1∶1∶22, yielding a Ca/P ratio of 1.29; (F) 3∶2∶2∶43, Ca/P ratio of 1.49; (G) 9∶5∶5∶106, Ca/P ratio of 1.76; (H) 2∶1∶1∶21, Ca/P ratio of 2.03. NLP were submitted to EDX immediately after formation. (I–L) Elemental composition of various NB preparations. (I and J) NB obtained from one-month-old DMEM cultures containing (I) 10% HS or (J) 10% FBS. Ca/P ratios: 1.75 (I) and 1.53 (J). (K) NB strain DSM 5819, after one week in DMEM without serum, giving a Ca/P ratio of 1.45. (L) “Nanons” after one week in DMEM; Ca/P ratio: 1.66.
Figure 3
Figure 3. Powder X-ray diffraction analysis of NLP and NB.
(A–D) Various amorphous and crystalline patterns are associated with NLP. NLP were prepared from the inoculation of 3 mM each of CaCl2, Na2CO3, and NaH2PO4 into DMEM. NLP were examined by XRD (A,B) immediately after formation, which revealed either an amorphous pattern (A) or the presence of the mono-calcium form CaHPO4(H2O)2, or they were examined after the following periods of incubation in DMEM at 37°C: (C) 1 day; and (D) 4 days. (E) NB obtained from DMEM containing 10% HS. (F) “Nanons” after one week in DMEM without serum. Peaks were assigned the specified chemical structure after comparing peaks with the database. With the exception of (C), which revealed the Ca9 form of HAP, the peaks seen in (D–F) all corresponded to Ca10 HAP. Peaks at 32.0 degrees and 31.8 degrees correspond to the Ca9 and Ca10 forms of HAP, respectively. Notice also the small peaks at 66.2 degrees seen only with the Ca10 form (D–F). Commercial powders of (G) CaCO3, (H) Ca3(PO4)2, and (I) HAP were included as controls.
Figure 4
Figure 4. Fourier-transformed infrared spectroscopy of NLP and NB reveals the presence of both carbonate and phosphate groups.
(A–D) NLP were prepared as in Fig. 3 and submitted to FTIR spectroscopy (A) immediately after formation, or after the following periods of incubation at 37°C in DMEM: (B) overnight; (C) one week; and (D) one month. The FTIR spectrum of NLP revealed peaks characteristic of carbonate ions at 875 cm−1 (ν2) and 1,430 cm−1 (ν3). Phosphate peaks were also present at 566 cm−1, 604 cm−1 (ν4), and between 1,033–1,100 cm−1 (ν3). The peak seen at 1,651 cm−1 was due to the presence of water in the sample. (E and F) NB showing FTIR spectra similar to those of NLP. (E) NB cultured from DMEM containing 10% healthy HS, after one month. (F) “Nanons” after one week in DMEM without serum. Commercial powders of (G) CaCO3, (H) Ca3(PO4)2, and (I) HAP were included as controls. CaCO3 produced an additional peak near 650 cm−1 attributed to calcite that was not found in our experimental samples.
Figure 5
Figure 5. Micro-Raman spectroscopy of NLP and NB reveals the presence of both carbonate and phosphate.
(A–D) NLP were prepared as in Fig. 3 and submitted to micron-Raman spectroscopy (A) immediately after formation, or after the following periods of incubation at 37°C in DMEM: (B) overnight and (C) one week. (D) NLP were prepared by addition of 10 mM each of Na2CO3 and (NH4)2CO3 in DMEM. Carbonate peaks were seen at 290 cm−1 and 1,070 cm−1, while phosphate peaks were seen at 440 cm−1, 581 cm−1, 962 cm−1, 1,048 cm−1, and 1,076 cm−1. The four NLP specimens show marked variability of peaks. (E) NB obtained from a culture of DMEM containing 10% HS reveal small peaks of phosphate at 440 cm−1 and 962 cm−1 as well as a carbonate peak at 1070 cm−1. (F) “Nanons” showing low peaks of phosphate at 440 cm−1, 581 cm−1, and 962 cm−1. Commercial powders of (G) CaCO3, (H) Ca3(PO4)2, and (I) HAP were included as controls.
Figure 6
Figure 6. Negative-staining TEM and electron diffraction patterns of NLP and NB.
(A–G) NLP were prepared as in Fig. 3 and submitted to TEM after incubation in DMEM at 37°C for either 2 days (A–C, G), 2 weeks (D), or 1 month (E and F). Round, dividing, or budding NLP are shown in close association with a crystalline phase, which shows either as a network of filamentous/membranous materials or as spindles/needles. The electron diffraction pattern characteristic of polycrystalline material obtained for both phases is shown in the inset. (B–D) show NLP with coccoid shapes and diameters smaller than 100 nm among larger particles. (D–F) Crystalline biofilms associated with NLP are seen with longer incubations. (F) is a magnified image of (E) depicting the transition between the round NLP and the crystalline matrix. (H and I) NB showing cell-dividing forms similar to NLP. (H) NB obtained from HS and (I) “nanons,” as in Fig. 3. Small crystalline projections can be distinguished on their surface. NB look virtually indistinguishable from NLP (compare with image G taken of NLP). Commercial (J) CaCO3, (K) Ca3(PO4)2, and (L) HAP produce a higher degree of crystallinity compared to NLP, NB, and “nanons” (insets). Scale bars: 100 nm (B–D, H–J, L); 200 nm (A, E–G, K).
Figure 7
Figure 7. Identical morphologies of NLP and NB seen by field-emission SEM.
(A–F) NLP were obtained as in Fig. 3 and incubated in DMEM for either 2 days (A and B), 4 days (D and E) or 1 month (C and F). (A) NLP consisted of spherical particles with a few dumbbell formations suggestive of cell division. (B) Enlarged image of NLP presented in (A) showing round particles with a size ranging 50–200 nm. (C) Conversion of round NLP to crystalline HAP in the form of needle-like formations along with large exposed hollow spheres in the shape of “igloos” and “shelter” forms of NB (see ref. 4). (D) Conversion of NLP into a crystalline film-like matrix. (E) Enlarged image of (D), showing crystalline surface of NLP, with their rough surface coated with small needle-like crystals. (F) Dense crystalline matrix formed after prolonged incubation of NLP. (G) Small-sized NLP obtained in the presence of excess magnesium and carbonate. NLP were prepared from the inoculation of 3 mM CaCl2, 18 mM Na2CO3, 3 mM NaH2PO4, and 3 mM MgCl2 into DMEM. (H) Enlarged image of NLP seen in (G), showing sizes typically around 100 nm. (I) NLP prepared as in (A), showing round particles attached to filamentous and membranous material. (J–L) NB with morphologies similar to those of NLP. (J) NB cultured from HS, as in Fig. 6, consisting of coalesced particles covered with needle-like formations. (K) “Nanons” and (L) NB strain DSM 5819 cultured in DMEM for one week without serum, showing round, ellipsoid and division-like large formations. (L) NB strain DSM 5819. Scale bars: 100 nm (B, I); 200 nm (A, C, F, H, J–L); 1 µm (G); 2 µm (C); 5 µm (D).
Figure 8
Figure 8. NLP and NB seen by thin-section TEM.
(A–C) Calcium phosphate NLP produced as in Fig. 3 and incubated overnight in DMEM. (A) shows heterogenous particles, while (B and C) represent enlarged views of (A), depicting round particles with thick concentric wall layers and crystalline surface with needle-like projections. Some particles appear to be undergoing cell division. (D–F) Calcium carbonate NLP obtained from the inoculation of 10 mM of CaCl2 and (NH4)2CO3 into DMEM, followed by overnight incubation in serum-free DMEM. (D) Aggregation of NLP to produce coalesced particles. (E and F) Enlarged images of (D), showing cell-division forms (E) and concentric multi-layers (F) with dense coating and crystalline structure. (E) Higher magnification image of the same NLP shown in D depicts a cellular division-like formation. Note the crystalline appearance of their surface and the interior of the particles. (G–I) “Nanons” after 2 days in serum-free DMEM, revealing multilayer crystalline rings surrounding an electron dense core. Scale bars: 100 nm (C); 200 nm (B, I); 500 nm (A, E, H); 1 µm (F, G); 5 µm (D).
Figure 9
Figure 9. Effect of serum, temperature, and EDTA on NLP formation.
NLP were prepared from 3 mM of CaCl2, Na2CO3, and NaH2PO4 in DMEM containing different amounts of FBS or HS, as indicated, followed by incubation at 37°C for 1 day (A and B), 1 week (E and F), or 4°C for 2 weeks (C and D). Note that FBS had a stronger, dose-dependent inhibitory effect on NLP formation in all 3 situations when compared with HS. Inhibition could be seen for 2 weeks at 4°C, but at 37°C, it was overcome after 1 week, and this release of inhibition was more evident with HS. (G) NLP were prepared exactly as in Fig. 1B, by adding solutions of 0.25 M CaCl2, Na2CO3, and NaH2PO4 (pH 7.4) to DMEM to the indicated concentrations in the presence of 10 mM EDTA, followed by incubation for 1 day. Addition of EDTA into the precipitation mix decreased the amount of NLP, except for well 6, containing 10 mM of precipitating reagents, indicating that excess EDTA is needed for the inhibition to work.
Figure 10
Figure 10. Effect of trypsin on NLP formation.
NLP were prepared by adding 1 mM of CaCl2, Na2CO3, and NaH2PO4 to DMEM containing the indicated amounts of serum, in the presence or absence of 0.5% trypsin, followed by incubation at 37°C for 1 day (A–D) or 3 days (E–H). Trypsin was shown not only to release the inhibition caused by FBS or HS, but also to produce a dose-dependent increase in the amount of precipitation that increased with the serum dosage. (I) Trypsin treatment on NLP as demonstrated by SDS-PAGE. NLP formed as in Fig. 9 from 3 mM each of the 3 precipitating reagents as well as 1% FBS in DMEM, either in the absence (lane 1) or presence (lane 2) of 0.5% trypsin. After overnight incubation of the 1 ml incubation mixture at 37°C, 100 µl was removed, pelleted by centrifugation, and washed twice in DMEM, and resuspended in 16 µl of 50 mM EDTA in double-distilled water for SDS-PAGE. Lane 3 contains 5 µg of trypsin, as control, which shows as a 25 kDa band. Note a prominent 72 kDa band and two fainter 54 kDa and 30 kDa bands associated with FBS NLP (lane 1), all of which disappears with trypsin treatment (lane 2).
Figure 11
Figure 11. Protein profiles of NLP and NB cultured from serum.
(A) Protein profiles of (A) NB cultured from HS and DMEM, as in Fig. 3; (B) NB strain DSM 5819 subcultured in serum-free DMEM for 2 days; (C) FBS NLP prepared as in Fig. 3 in the presence of 5% FBS; (D) HS NLP prepared as in Fig. 3 in the presence of 5% HS. (E) NB as in (A) after three 2-day serial passages through serum-free DMEM. (F) Lane 1: “Nanons” after two 2-day passages in serum-free DMEM. Lane 2: “Nanons” after two 2-day passages in DMEM containing 10% FBS. Gels were stained with Coomassie blue. The protein samples loaded onto each lane and their preparation are described in the Materials and Methods .
Figure 12
Figure 12. Protein profiles of whole FBS and HS.
SDS-PAGE of decreasing amounts of whole FBS (lanes 1–5), and HS (lanes 6–10). FBS or HS was used at 1∶100 dilution, with the following amounts of protein loaded onto each lane: lanes 1–5: 4 µg, 3.5 µg, 3 µg, 2.5 µg, and 1.5 µg, respectively; and lanes 6–10: 3 µg, 1.8 µg, 1.2 µg, 0.6 µg, and 0.3 µg, respectively. The white dots shown in lanes 5 and 10 correspond to the bands excised for protein identification by MALDI-TOF mass fingerprint analysis.
Figure 13
Figure 13. Protein profiles of NLP and NB as determined by their passage through serum-free or serum-containing medium.
(A) Protein profile of HS NB maintained in DMEM containing 5% HS (lane 1) followed by transfer to serum-free DMEM and incubation for 1 day (lane 2), 4 days (lane 3), and 6 days (lane 4), after which proteins were analyzed by SDS-PAGE. A gradual disappearance of proteins bands is seen with increased incubation time in serum-free medium. (B) Protein profile of NB strain DSM 5821 after 1 day in DMEM containing 2% FBS (lane 1), followed by transfer to serum-free DMEM for 1 day (lane 2), 4 days (lane 3), and 6 days (lane 4), again showing a gradual disappearance of bands. (C) Protein profiles of NB obtained from 10% HS as in Fig. 3 (lane 1) and HS NLP formed as in Fig. 3 except that 5% HS was present in the precipitating mixture (lane 2). HS NLP were then transferred to DMEM containing 5% HS and incubated for the following periods of time: 1 hr (lane 3), 1 day (lane 4), 4 days (lane 5), 10 days (lane 6), and 14 days (lane 7). A gradual increase of bands of low molecular weight could be seen along with a fading of the high molecular weight bands, especially the 70–72 kDa band. (D) Protein profiles of NB strain DSM 5820 maintained in 10% γ-irradiated FBS (lane 1) and FBS NLP obtained as in Fig. 3, except that 5% FBS was added to the precipitating mixture (lane 2). FBS NLP were inoculated into DMEM containing 5% FBS and incubated for the following periods of time: 2 hr (lane 3), 1 day (lane 4), 4 days (lane 5), 10 days (lane 6), and 14 days (lane 7). By day 14, the protein profile of these FBS NLP, with an increase in the number of bands and a loss of the 70–72 kDa band, closely resembled that of DSM 5820 (lane 1).
Figure 14
Figure 14. Protein identification in NLP prepared from FBS and HS.
Protein profiles correspond to Figs. 11C and D, reproduced here to illustrate the protein identification procedure used as well as the results obtained. NLP were prepared from DMEM containing 5% FBS or 5% HS that had been precipitated with 10 mM each of CaCl2, Na2CO3, and NaH2PO4. Following SDS-PAGE and Coomassie blue staining, the bands were excised (white dots) and submitted to identification by MALDI-TOF mass fingerprint analysis. The proteins identified are given along with their positions. Abbreviations used: BSA, bovine serum albumin; BSF, bovine serum fetuin-A; b Apo-A1, bovine apolipoprotein A1; HSA, human serum albumin; HSF, human serum fetuin-A; and h Apo-A1, human apolipoprotein A1. Other minor protein bands include a bovine 95 kDa band (▪) which was identified as bovine serotransferrin precursor (2 out of 2 trials, or 2/2), and other minor human bands at 165 kDa (•), 130 kDa (♦), 95 kDa (◃) identified as human complement C3 (2/2), human antithrombin (2/2), and human complement C3 (2/2), respectively.
Figure 15
Figure 15. Proteins identified in NLP prepared from various body fluids.
NLP were prepared from body fluids in the presence of CaCl2, Na2CO3, and NaH2PO4 added to final concentrations of 9 mM each for saliva, 7 mM for urine, and 8 mM for the other body fluids. Following SDS-PAGE, the NLP proteins identified by MALDI-TOF mass fingerprint analysis are shown next to each major band. Other minor bands in the 50–65 kDa range marked by the symbol (◃) include (B) IgG chain C region (obtained 1 out of 1 trial, or 1/1); (C) IgG chain C region (1/1); (D) HSA (1/3), IgG chain C region (1/3), and α-anti-trypsin (1/3); (E) HSA (2/2); and (F) vitamin-D binding protein (1/3), IgG chain C region (1/3), and Apo-A4 (1/3).
Figure 16
Figure 16. Protein profiles of saliva and urine NLP are determined by their passage through medium containing various amounts of serum.
(A) Saliva NLP, obtained as in the Materials and Methods , were inoculated into serum-free DMEM for 1 day (lane 1), 2 days (lane 2), and 14 days (lane 3). NLP were then pelleted, washed, and introduced into DMEM containing 5% HS, and incubated for 1 day (lane 4) and 12 days (lane 5). (B) Saliva NLP were inoculated into DMEM containing 5% HS for 4 h (lane 1), then pelleted, washed, and inoculated into serum-free DMEM for 1 day (lane 2), 2 days (lane 3), 5 days (lane 4), and 6 days (lane 5). (C) Urine NLP inoculated into serum-free DMEM and incubated for 1 day (lane 1), 2 days (lane 2) and 4 days (lane 3), after which NLP were collected, washed, and reinoculated into DMEM containing 5% HS and incubated for 2 days (lane 4). Formation of NLP from saliva and urine, their processing and subculturing, and standardization of the protein contents loaded onto each lane are described in the Materials and Methods. Note the gradual fading of protein bands in serum-free medium as well as the acquisition of multiple protein bands in the presence of serum.
Figure 17
Figure 17. Sequence homology between fetuin-A and albumin.
(A) Sequences were compared with the ClustalW program. The term “identity” refers to the presence of the same amino acids while “similarity” refers to the presence of different amino acids with similar chemical properties as assessed with the Gonnet matrix. Note limited homologies between fetuin-A and albumin from both bovine and human species. (B) Sequence alignment was done using the complete primary sequence of BSF (341 a.a.) as basis for comparison, while portions of the longer HSF (349 a.a.), BSA (583 a.a.), and HSA (585 a.a.) sequences were deleted at various sites for purposes of fitting the alignment. Identical amino acids are highlighted in yellow. The meter on top of the sequences refers to BSF only.
Figure 18
Figure 18. NB-specific antibodies cross-react with albumin and fetuin-A.
Western blots on various bovine and human protein samples (bottom of each blot) were done using the indicated antibodies (to the right of each blot). Antigens used include FBS NLP and HS NLP obtained as in Fig. 14; purified BSA, BSF, HSF, and human recombinant fetuin-A (HRF); and whole FBS and HS. Antibodies used include a polyclonal antibody directed against BSF (p-α-BSF); a monoclonal antibody directed against BSA (m-α-BSA); a polyclonal antibody directed against HSF (p-α-HSF); and the monoclonal antibodies 8D10, NB 5/3, and NB G1B8 directed against bovine NB antigens (m-α-NB 8D10, m-α-NB 5/3, and m-α-NB G1B8, respectively). All gels were run under denaturing and reducing conditions except for (L and M), which were electrophoresed under non-reducing conditions.
Figure 19
Figure 19. Inhibition of NLP formation by fetuin-A and albumin.
(A) NLP were prepared from 0.5 mM to 6 mM each of CaCl2, Na2CO3, and NaH2PO4 added to water. A650 readings using a spectrophotometer show dose-dependent increase in optical density with NLP formation that displays a linear relationship seen between 2 and 4 mM of precipitating reagents used. (B) The inhibitory effects of fetuin-A and albumin on NLP formed in water were studied using 3 mM each of the three precipitating reagents. BSF or HSA were added to the indicated concentrations prior to the addition of the precipitating reagents. Compared to HSA, BSF showed markedly higher inhibitory potency on NLP formation.
Figure 20
Figure 20. NLP associated with fetuin-A or albumin are morphologically similar.
NLP were produced as described in Fig. 19, with 3 mM each of CaCl2, Na2CO3, and NaH2PO4 incubated with either 10 µM of BSF (A–C), 50 µM of HSA (D–F), or a combination of 10 µM of BSF and 50 µM of HSA (G–I). Incubation was done for 3 days (A, B, D, E, G, and H) or 1 week (C, E, and I) at room temperature. The initially clear solutions increased in turbidity with time, and by 3 days showed noticeable precipitation, which were then pelleted by centrifugation and washed with HEPES buffer once, followed by another wash with water, prior to SEM analysis. (B, E, and H) represent enlarged views of (A, D, and G), respectively. By one week of incubation, the round particles had coalesced to form films. Round particles or films seen with the 3 types of treatments appear virtually identical. Scale bars: 100 nm (B,D,F); 500 nm (A,C,E).
Figure 21
Figure 21. Demonstration by SDS-PAGE of the presence of fetuin-A and albumin in NLP formed from inhibitory complexes.
NLP were prepared as in Figs. 19 and 20, from 3 mM each of CaCl2, Na2CO3, and NaH2PO4 in 1 ml of water incubated with either BSF or HSA at the following concentrations: 40 µg/ml, 80 µg/ml, 160 µg/ml, and 320 µg/ml of BSF, corresponding to lanes 1–4, respectively; and 0.2 mg/ml, 0.4 mg/ml, 0.8 mg/ml, and 1.6 mg/ml of HSA, for lanes 5–8, respectively. After an incubation of 3 days at room temperature, centrifuged pellets were washed three times with HEPES buffer, and the final washed pellets were resuspended in 50 µl of double-distilled water containing 50 mM EDTA, of which 16 µl were loaded onto each lane. Note the presence of multiple bands around 50–70 kDA associated with BSF and a prominent band centered around 72 kDa corresponding to HSA.

References

    1. Kajander EO, Kuronen I, Akerman K, Pelttari A, Ciftcioglu N. Nanobacteria from blood, the smallest culturable autonomously replicating agent on Earth. Proc Soc Photo Opt Instrum Eng. 1997;3111:420–428.
    1. Kajander EO, Ciftcioglu N. Nanobacteria: An alternative mechanism for pathogenic intra- and extracellular calcification and stone formation. Proc Natl Acad Sci U S A. 1998;95:8274–8279. - PMC - PubMed
    1. Kajander EO. Nanobacteria: propagating calcifying nanoparticles. Lett Appl Microbiol. 2006;42:549–552. - PubMed
    1. Ciftcioglu N, McKay DS, Mathew G, Kajander EO. Nanobacteria: Fact or fiction? Characteristics, detection, and medical importance of novel self-replicating, calcifying nanoparticles. J Investig Med. 2006;54:385–394. - PubMed
    1. Ciftcioglu N, Bjorklund M, Kuorikoski K, Bergstrom K, Kajander EO. Nanobacteria: An infectious cause for kidney stone formation. Kidney Int. 1999;56:1893–1898. - PubMed

Publication types