. 2009 Jun;10(2):295-308.
doi: 10.1007/s10162-009-0157-z. Epub 2009 Feb 7.

Loudness perception in the domestic cat: reaction time estimates of equal loudness contours and recruitment effects

Affiliations

Loudness perception in the domestic cat: reaction time estimates of equal loudness contours and recruitment effects

Bradford J May et al. J Assoc Res Otolaryngol. 2009 Jun.

Abstract

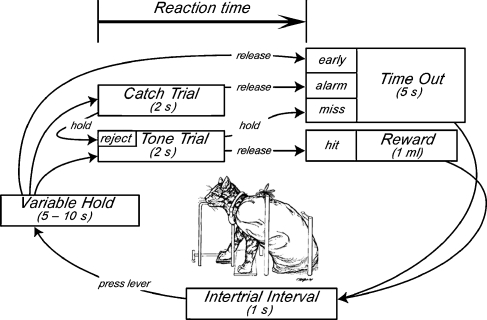
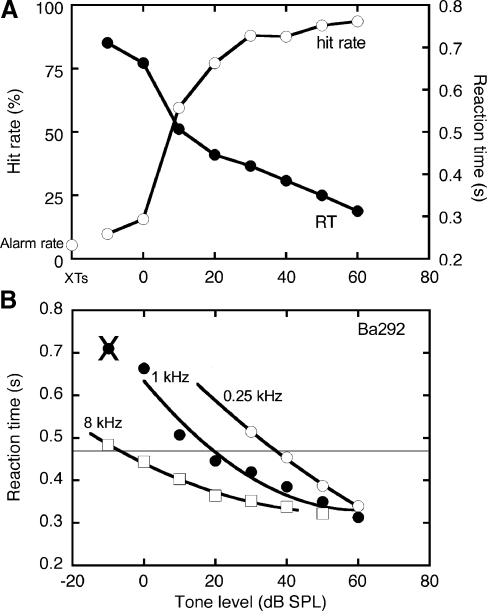
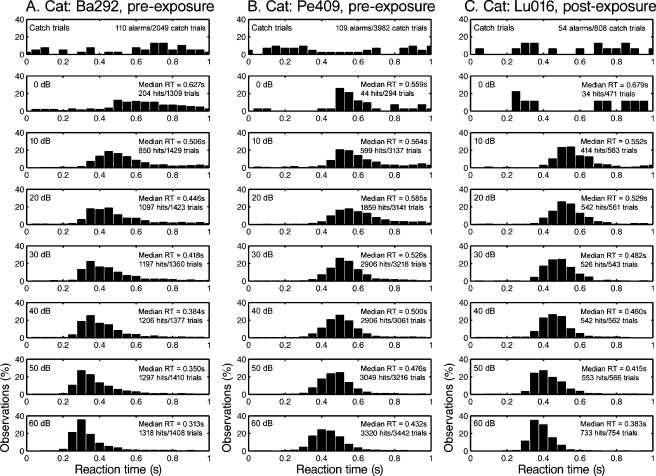
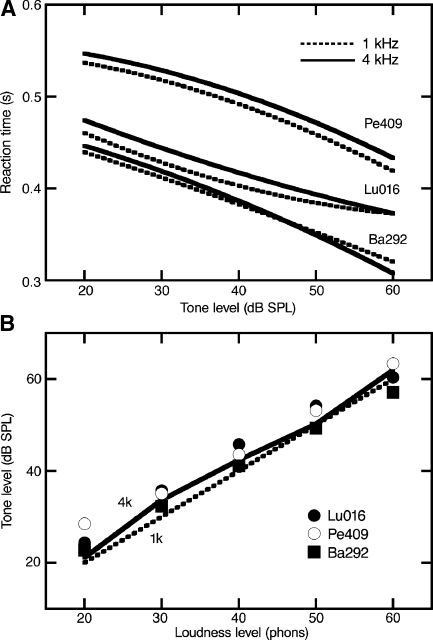
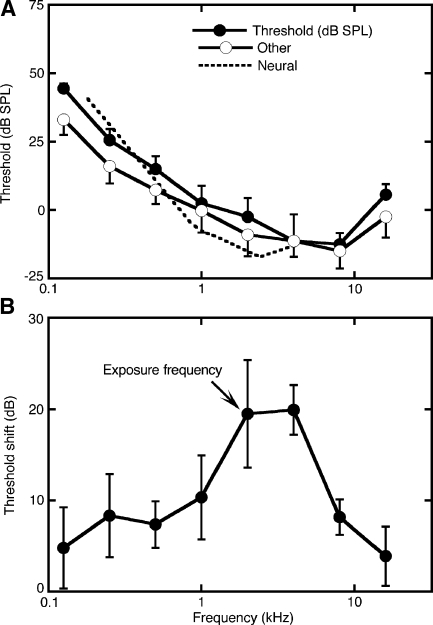
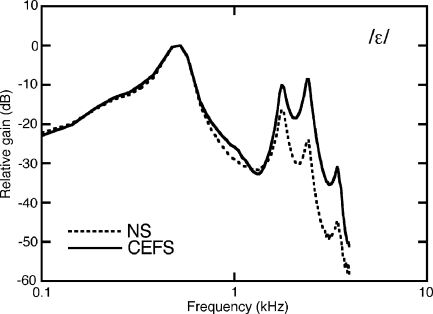
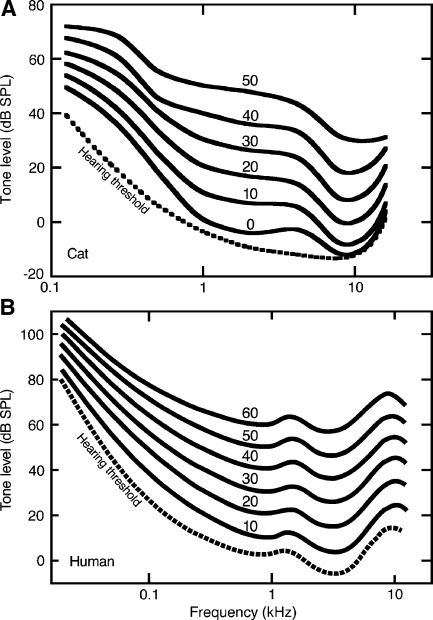
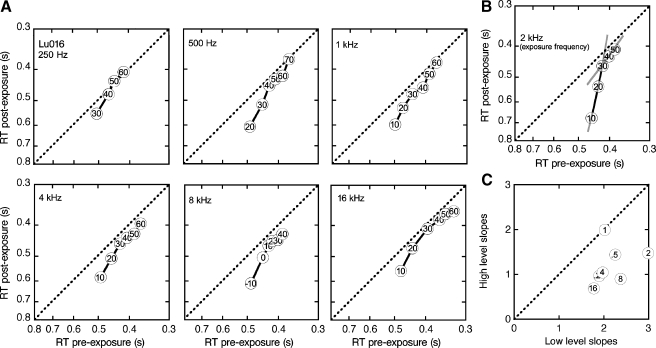
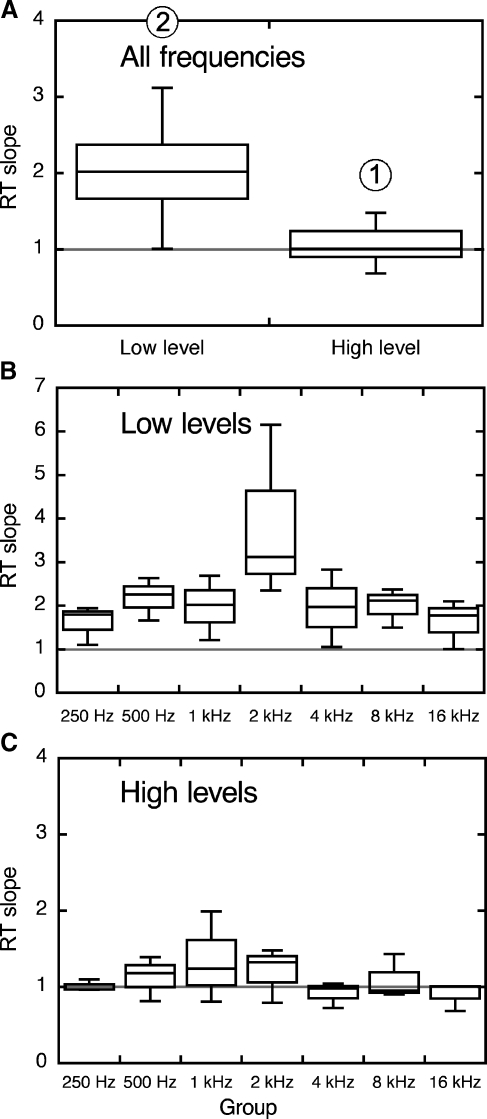
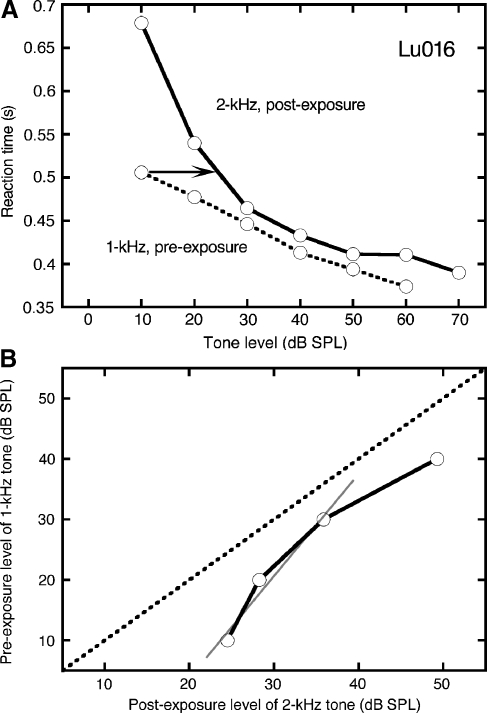
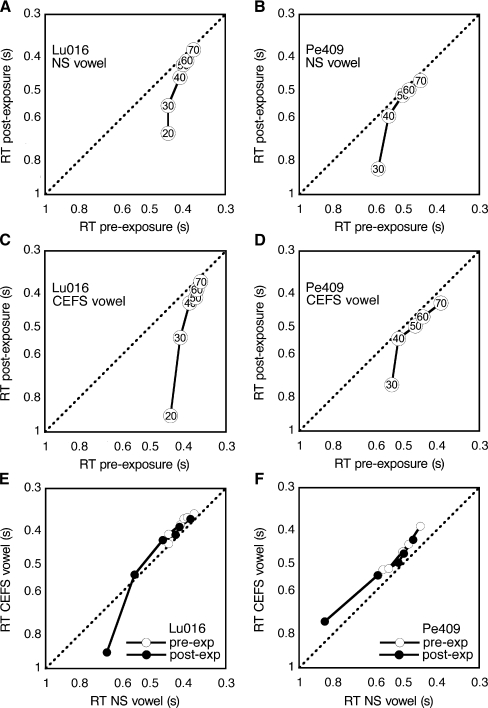
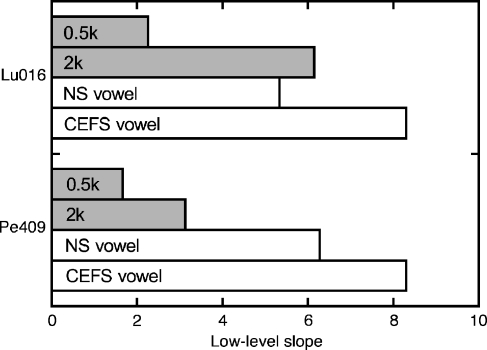
The domestic cat is the primary physiological model of loudness coding and recruitment. At present, there are no published descriptions of loudness perception in this species. This study used a reaction time task to characterize loudness perception in six behaviorally trained cats. The psychophysical approach was based on the assumption that sounds of equal loudness elicit responses of equal latency. The resulting equal latency contours reproduced well-known features of human equal loudness contours. At the completion of normal baseline measures, the cats were exposed to intense sound to investigate the behavioral correlates of loudness recruitment, the abnormally rapid growth of loudness that is commonly associated with hearing loss. Observed recruitment effects were similar in magnitude to those that have been reported in hearing-impaired humans. Linear hearing aid amplification is known to improve speech intelligibility but also exacerbate recruitment in impaired listeners. The effects of speech spectra and amplification on recruitment were explored by measuring the growth of loudness for natural and amplified vowels before and after sound exposure. Vowels produced more recruitment than tones, and the effect was exacerbated by the selective amplification of formant structure. These findings support the adequacy of the domestic cat as a model system for future investigations of the auditory processes that underlie loudness perception, recruitment, and hearing aid design.


Figures

FIG. 1
FIG. 1
Contingencies of reinforcement for the tone detection task. Inset shows the behavioral testing platform and restraint system.
FIG. 2
FIG. 2
Typical responses in the tone detection task (cat Ba292). A Psychometric functions for tests with 1-kHz tones. B Effects of frequency on RT-level functions. Actual RTs (symbols) have been fitted with second-order polynomials (lines). The data at −10 dB SPL are not included in the 1-kHz fit because the stimulus condition elicited a hit rate that was not significantly different from the subject’s false alarm rate.
FIG. 3
FIG. 3
Effects of SPL on the reaction time (RT) distributions that were produced by 1-kHz tones. Presentation level increases from upper to lower panels. Responses to catch trials are shown in the uppermost panels. A, B Pre-exposure data for cats Ba292 and Pe409. C Post-exposure data for cat Lu016.
FIG. 4
FIG. 4
Individual differences in RT data. A RT-level functions obtained from three cats at 1 kHz (dashed lines) and 4 kHz (solid lines). B Growth of loudness functions (GOLFs) for the three cats (symbols) and the average of six cats (lines). Reaction times were translated to units of loudness (phons) based on individualized response latencies (see text).
FIG. 5
FIG. 5
Pre- and post-exposure hearing sensitivity of the behavioral cats. A Average detection threshold (±SEM) of six cats as a function of tone frequency. For comparison, average thresholds (±SEM) are shown for six independent behavioral studies (Other), as reported by Fay (1995). Best neural thresholds (Neural) are also provided for cats that were procured from the same supplier (Liberty Labs). B Permanent threshold shifts in four behavioral cats that were exposed for 4 h to a narrow band of noise at a level of 109 dB SPL. The center frequency of the noise band was 2 kHz (arrow).
FIG. 6
FIG. 6
Formant structure of the English vowel /ɛ/. Relative to the naturally shaped (NS) vowel, the contrast-enhanced frequency-shaped (CEFS) vowel has more energy in its upper formants.
FIG. 7
FIG. 7
Average equal latency contours for the six cats in the present study (A) and equal loudness contours estimated from human psychophysical studies (B). Numerical labels specify the loudness level in phons. Dashed lines indicate absolute thresholds. Threshold function for cats was derived by averaging the three data sources in Figure 5A. Human data are taken from Suzuki and Takeshima (2004).
FIG. 8
FIG. 8
Effects of sound exposure on RT functions. Results are shown for cat Lu016. A Each panel plots RTs at the same frequency and SPL before and after sound exposure. Numerical labels indicate SPL. Points falling to the right of the unity line suggest decreased loudness level after exposure. B The growth of loudness was estimated from the slopes of linear fits that were applied separately to low- and high-level data points. Representative fits are shown for 2-kHz data (gray lines). C Scatterplot of low- versus high-level slopes of the seven RT functions. Points falling to the right of the unity line have a higher slope (more rapid growth of loudness) at lower sound levels. Numerical labels indicate the tone frequencies that produced the data points. The low-level slope at the 2-kHz exposure frequency (6.15) falls outside the upper limit of the x-axis and is plotted on the right y-axis.
FIG. 9
FIG. 9
Distributions of RT slopes for all cats. Methods for the calculation of slopes are illustrated in Figure 8. Conventions for boxplots are described in text. A Low- and high-level distributions collapsed across all frequencies. The difference between slopes is statistically significant (p < 0.001, paired sign test). The average high level slope was not significantly different from 1 (sign test). The maximum range has been truncated at 4 to facilitate visual comparisons between the two datasets. The outlier among the low-level data is the 2-kHz slope of cat Lu016 (6.15), which is plotted at the upper limit of the y-axis. B, C Low- and high-level slopes separated by frequency. Note the expanded y-axis for low-level slopes.
FIG. 10
FIG. 10
Loudness-matching results for cat Lu016. A The relationship between tone level and RT at 1 kHz before exposure and 2 kHz after exposure. To elicit the RT of the 1-kHz tone at 10 dB SPL, the 2-kHz tone must be 24.5 dB SPL (arrow). B Growth of loudness function (GOLF) derived from the RTs in A. Recruitment is suggested by the rapid rise in loudness at low levels. A linear fit (gray line) to pre-exposure loudness levels of 10–30 dB produced a slope of 1.7.
FIG. 11
FIG. 11
Effects of sound exposure on RT for naturally shaped (NS) and contrast-enhanced frequency-shaped (CEFS) vowels. Results are shown for cats Lu016 and Pe405. A, B Pre-exposure versus post-exposure RTs for the NS vowel. C, D Reaction times for the CEFS vowel. Plotting conventions are described in Figure 8. E, F Reaction times for CEFS versus NS vowels before and after exposure. Points falling along the unity line indicate similar loudness effects for the two spectral shapes.
FIG. 12
FIG. 12
The LMRT slopes of pure tones (gray fill) and vowels (white fill). Tone frequencies approximate the formant frequencies of the vowels. Results at low sound levels are shown for cats Lu016 and Pe409. A larger slope indicates stronger recruitment.

References

    1. {'text': '', 'ref_index': 1, 'ids': [{'type': 'DOI', 'value': '10.1037/0096-1523.29.3.523', 'is_inner': False, 'url': 'https://doi.org/10.1037/0096-1523.29.3.523'}, {'type': 'PubMed', 'value': '12848324', 'is_inner': True, 'url': 'https://pubmed.ncbi.nlm.nih.gov/12848324/'}]}
    2. Arieh Y, Marks LE. Recalibrating the auditory system: a speed-accuracy analysis of intensity perception. J. Exp. Psychol. Hum. Percept. Perform. 29:523–536, 2003. - PubMed
    1. {'text': '', 'ref_index': 1, 'ids': [{'type': 'DOI', 'value': '10.1002/cne.902950106', 'is_inner': False, 'url': 'https://doi.org/10.1002/cne.902950106'}, {'type': 'PubMed', 'value': '2341636', 'is_inner': True, 'url': 'https://pubmed.ncbi.nlm.nih.gov/2341636/'}]}
    2. Benson TE, Brown MC. Synapses formed by olivocochlear axon branches in the mouse cochlear nucleus. J. Comp. Neurol. 295:52–70, 1990. - PubMed
    1. Cai S, Ma WL, Young ED. Encoding intensity in ventral cochlear nucleus following acoustic trauma: implications for loudness recruitment. J. Assoc. Res. Otolaryngol. 2009 (in press). - PMC - PubMed
    1. {'text': '', 'ref_index': 1, 'ids': [{'type': 'DOI', 'value': '10.1093/brain/8.4.512', 'is_inner': False, 'url': 'https://doi.org/10.1093/brain/8.4.512'}]}
    2. Cattell JM. The influence of the intensity of the stimulus on the length of the reaction time. Brain 8:512–515, 1886.
    1. {'text': '', 'ref_index': 1, 'ids': [{'type': 'DOI', 'value': '10.3406/psy.1940.5877', 'is_inner': False, 'url': 'https://doi.org/10.3406/psy.1940.5877'}]}
    2. Chocholle R. Variation des temps de réaction auditifs en fonction de l' intensité à diverses fréquences. L’ Année Psychologique 41:65–124, 1940.

Publication types

LinkOut - more resources