. 2009 Dec;15(4):531-40.
doi: 10.1089/ten.TEC.2008.0486.

Quantitative analysis of complex glioma cell migration on electrospun polycaprolactone using time-lapse microscopy

Affiliations

Quantitative analysis of complex glioma cell migration on electrospun polycaprolactone using time-lapse microscopy

Jed Johnson et al. Tissue Eng Part C Methods. 2009 Dec.

Abstract

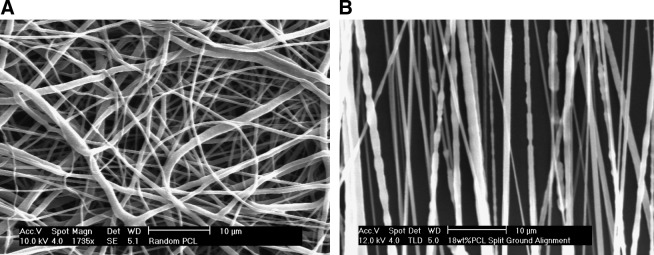
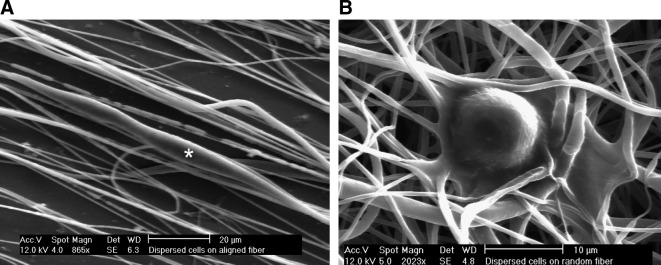
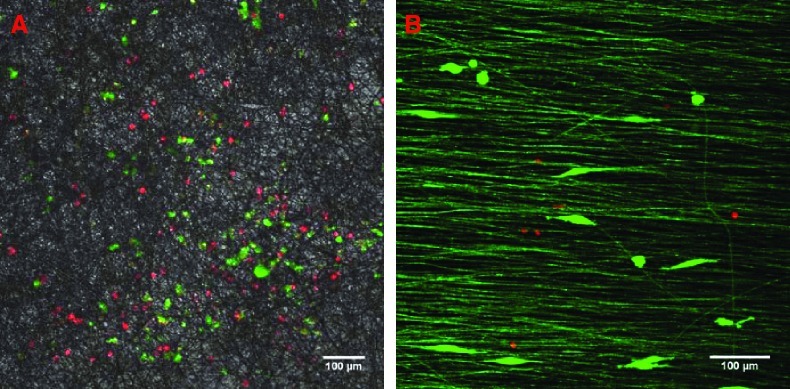
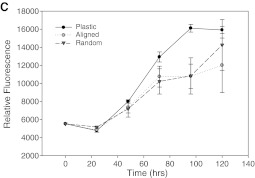
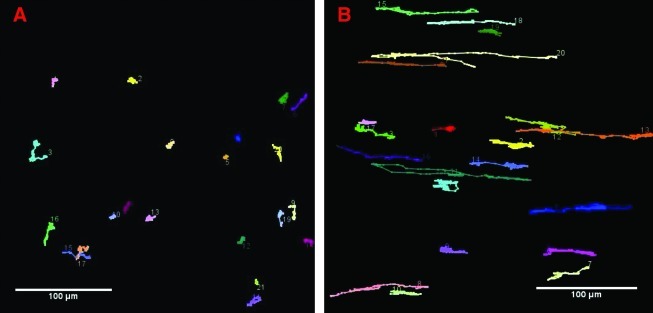
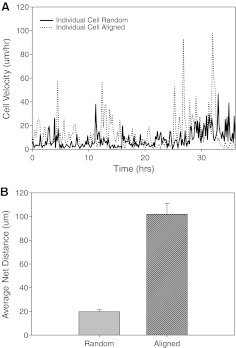
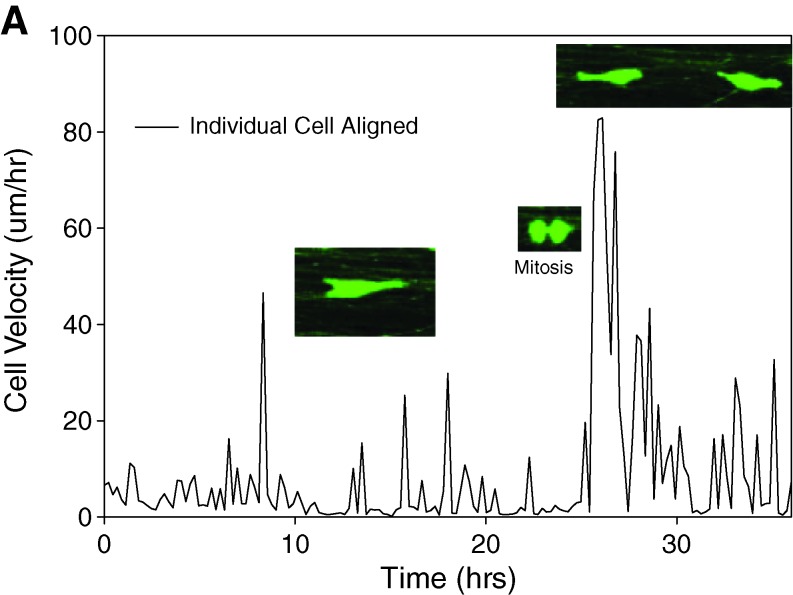
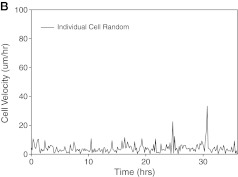
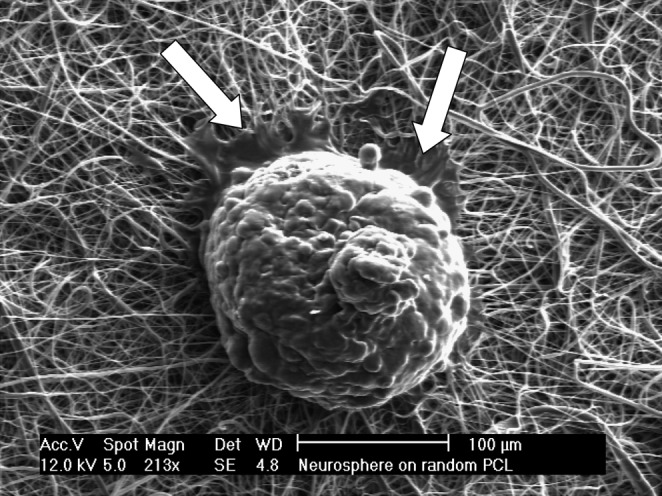
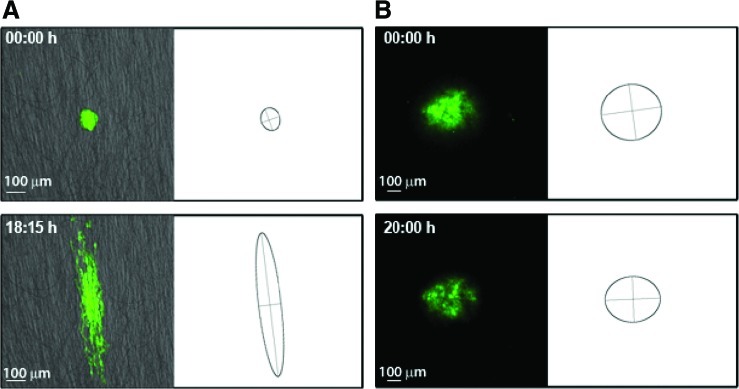
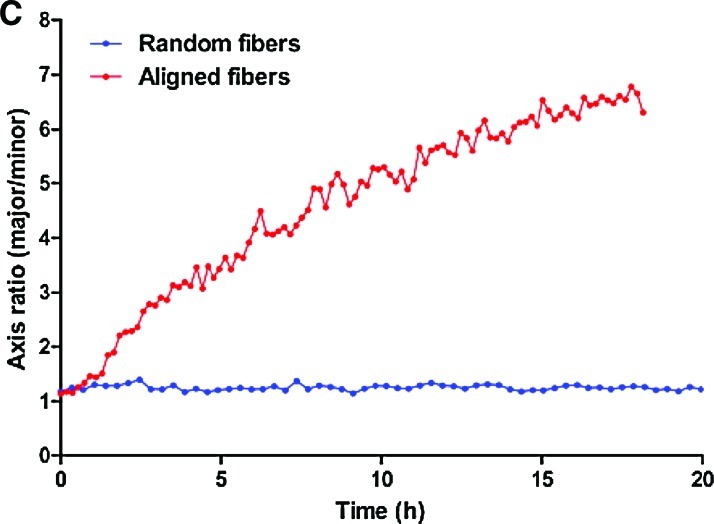
Malignant gliomas are the most common tumors originating within the central nervous system and account for over 15,000 deaths annually in the United States. The median survival for glioblastoma, the most common and aggressive of these tumors, is only 14 months. Therapeutic strategies targeting glioma cells migrating away from the tumor core are currently hampered by the difficulty of reproducing migration in the neural parenchyma in vitro. We utilized a tissue engineering approach to develop a physiologically relevant model of glioma cell migration. This revealed that glioma cells display dramatic differences in migration when challenged by random versus aligned electrospun poly-epsilon-caprolactone nanofibers. Cells on aligned fibers migrated at an effective velocity of 4.2 +/- 0.39 microm/h compared to 0.8 +/- 0.08 microm/h on random fibers, closely matching in vivo models and prior observations of glioma spread in white versus gray matter. Cells on random fibers exhibited extension along multiple fiber axes that prevented net motion; aligned fibers promoted a fusiform morphology better suited to infiltration. Time-lapse microscopy revealed that the motion of individual cells was complex and was influenced by cell cycle and local topography. Glioma stem cell-containing neurospheres seeded on random fibers did not show cell detachment and retained their original shape; on aligned fibers, cells detached and migrated in the fiber direction over a distance sixfold greater than the perpendicular direction. This chemically and physically flexible model allows time-lapse analysis of glioma cell migration while recapitulating in vivo cell morphology, potentially allowing identification of physiological mediators and pharmacological inhibitors of invasion.


Figures

FIG. 1.
FIG. 1.
SEM of as-deposited, randomly oriented PCL fibers (A) and aligned PCL fibers (B). Scale bars: 10 μm.
FIG. 2.
FIG. 2.
SEM showing examples of isolated U251 glioma cells migrating on aligned (A) or randomly oriented (B) PCL fibers. Note the cell in the center of (A) denoted with an asterisk. Cells on randomly oriented substrates interact with many fibers and do not show preferential pseudopodia extension. Conversely, cells on aligned substrates interact with relatively few nanofibers and are highly elongated in the direction of alignment.
FIG. 3.
FIG. 3.
Confocal microscopy of U251 glioma cells detected by nuclear red and cytoplasmic green fluorescence on random (A) and aligned (B) PCL fibers. Random fibers in (A) are shown under phase contrast illumination; aligned fibers in (B) are shown under fluorescent illumination and appear green due to internal reflection of fluorescence. Scale bars: 100 μm. The growth curve of U251 glioma cells cultured on TCPS, aligned nanofibers, and random nanofibers is shown in (C). Color images available online at www.liebertonline.com/ten.
FIG. 3.
FIG. 3.
Confocal microscopy of U251 glioma cells detected by nuclear red and cytoplasmic green fluorescence on random (A) and aligned (B) PCL fibers. Random fibers in (A) are shown under phase contrast illumination; aligned fibers in (B) are shown under fluorescent illumination and appear green due to internal reflection of fluorescence. Scale bars: 100 μm. The growth curve of U251 glioma cells cultured on TCPS, aligned nanofibers, and random nanofibers is shown in (C). Color images available online at www.liebertonline.com/ten.
FIG. 4.
FIG. 4.
Motion cell-tracking of individual cells on as-deposited, random (A) and aligned (B) PCL nanofibers. The figure represents approximately 20 individual trajectories traced manually after a total tracking period of 36 h. Scale bars: 100 μm. Color images available online at www.liebertonline.com/ten.
FIG. 5.
FIG. 5.
Quantification of cell motion on nanofibers. (A) Point-to-point velocity of an individual cell seeded on random and aligned PCL fibers. (B) Net distance (mean ± SE) traveled by the cells on random and aligned PCL fibers over a 36 h period.
FIG. 6.
FIG. 6.
Representative motion of individual cells on aligned (A) and random (B) PCL nanofibers. The inset pictures show events of cell division, which were usually followed by a burst of motion of the daughter cells. Color images available online at www.liebertonline.com/ten.
FIG. 6.
FIG. 6.
Representative motion of individual cells on aligned (A) and random (B) PCL nanofibers. The inset pictures show events of cell division, which were usually followed by a burst of motion of the daughter cells. Color images available online at www.liebertonline.com/ten.
FIG. 7.
FIG. 7.
Representative image of a glioblastoma neurosphere seeded on a random PCL fiber scaffold. Notice the formation of adhesion lamellipodia (arrows) but predominant absence of cell detachment from the neurosphere. Scale bar: 100 μm.
FIG. 8.
FIG. 8.
Representative frames showing cell dispersion from neurospheres seeded on aligned (A) and random (B) PCL fibers. The corresponding bounding ellipses were estimated by principal component analysis. The change in the ratio of the elliptic axes over time (i.e., a measure of anisotropic cell spread) revealed a sixfold increase in along-axis versus across-axis migration on aligned fibers (C). Color images available online at www.liebertonline.com/ten.
FIG. 8.
FIG. 8.
Representative frames showing cell dispersion from neurospheres seeded on aligned (A) and random (B) PCL fibers. The corresponding bounding ellipses were estimated by principal component analysis. The change in the ratio of the elliptic axes over time (i.e., a measure of anisotropic cell spread) revealed a sixfold increase in along-axis versus across-axis migration on aligned fibers (C). Color images available online at www.liebertonline.com/ten.

References

    1. Central Brain Tumor Registry of the United States. Statistical Report: Primary Brain Tumors in the United States 1998–2002. CBTRUS. 2005.
    1. Holland E.C. Glioblastoma multiforme: the terminator. Proc Natl Acad Sci USA. 2000;97:6242. - PMC - PubMed
    1. Fathallah-Shaykh H.M. Darts in the dark cure animal, but not human, brain tumors. Arch Neurol. 2002;59:721. - PubMed
    1. Salgaller M.L. Liau L.M. Current status of clinical trials for glioblastoma. Rev Recent Clin Trials. 2006;1:265. - PubMed
    1. Tonn J.C. Goldbrunner R. Mechanisms of glioma cell invasion. Acta Neurochir. 2003;(Suppl 88):163. - PubMed

Publication types

LinkOut - more resources