Comparative Study
. 2009 Apr;109(1):257-67.
doi: 10.1111/j.1471-4159.2009.05957.x. Epub 2009 Feb 5.

SUMOylation participates in induction of ischemic tolerance

Affiliations
Comparative Study

SUMOylation participates in induction of ischemic tolerance

Yang Ja Lee et al. J Neurochem. 2009 Apr.

Abstract

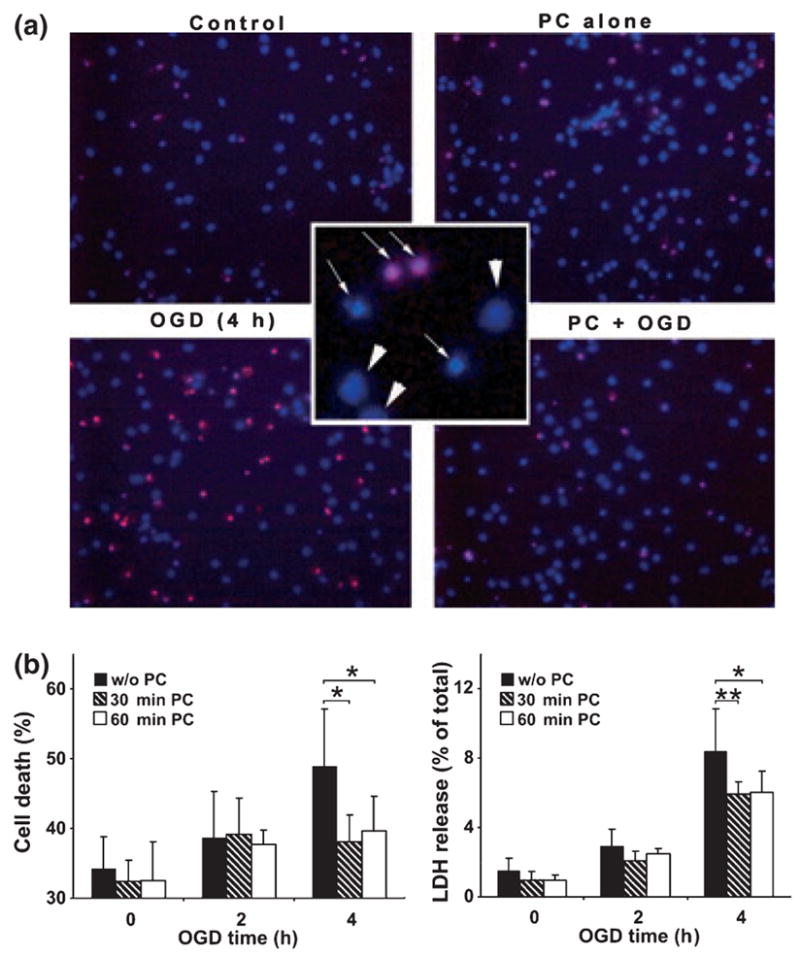
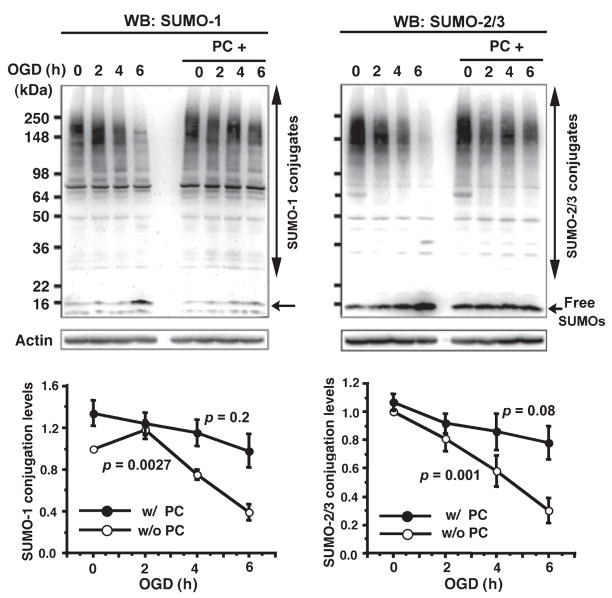
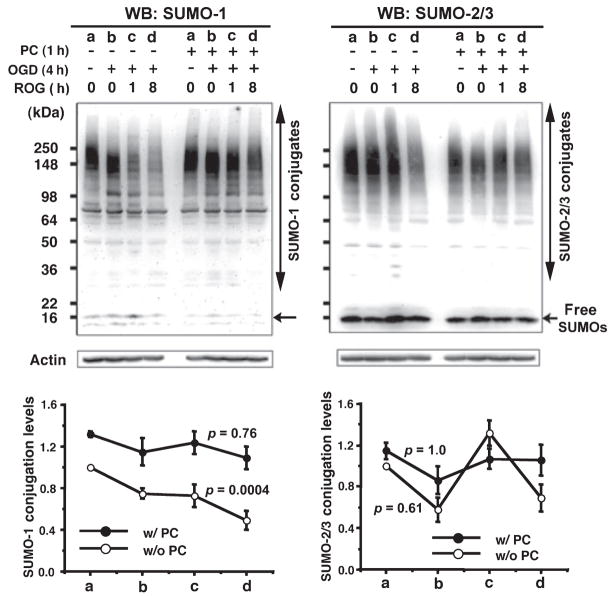
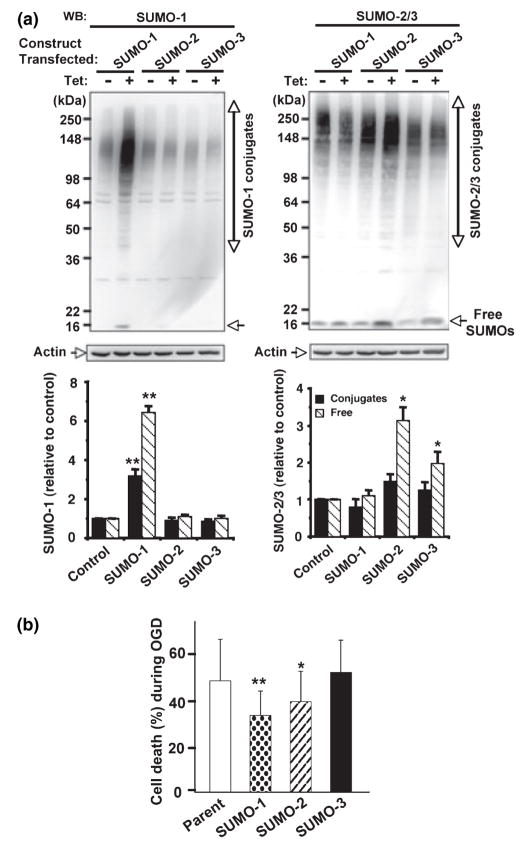
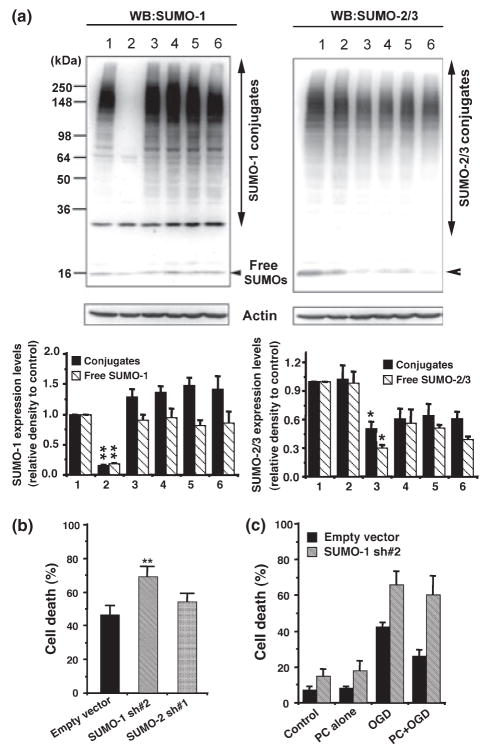
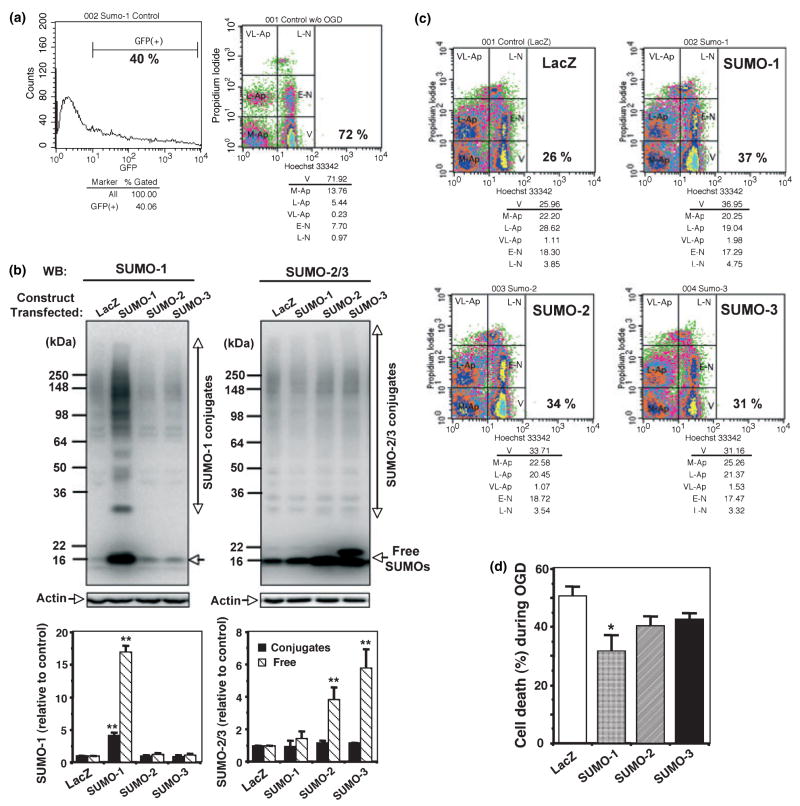
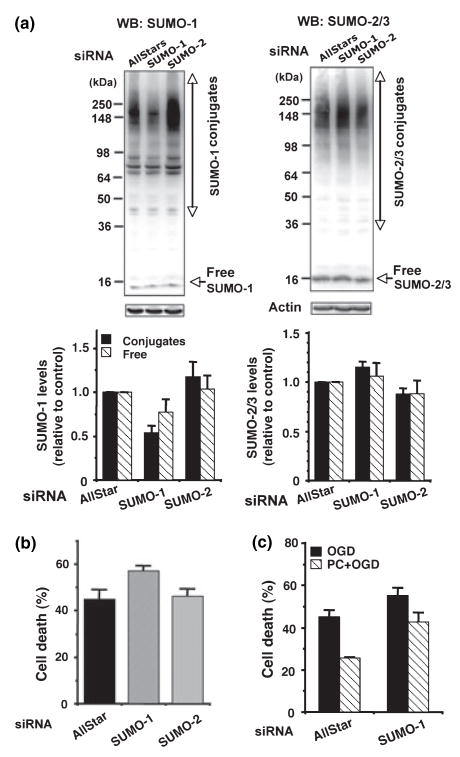
Ground squirrels in hibernation torpor have been shown to have striking increases in global SUMOylation on tissue immunoblots. Here, we find evidence that global SUMOylation is also involved in ischemic tolerance in primary cortical neuronal cultures (from rats and mice) and SHSY5Y human neuroblastoma cells. Cultured cortical neurons preconditioned by sublethal oxygen/glucose deprivation (OGD) were less vulnerable to severe OGD than non-preconditioned neurons. Preconditioned neurons maintained elevated SUMO-1 conjugation levels (and, to a lesser extent those of SUMO-2/3) on western blots in contrast to non-preconditioned cells. Further, cortical neurons and SHSY5Y cells in which transfected SUMO-1 or SUMO-2 were over-expressed showed increased survival after severe OGD. In contrast, cell cultures subjected to depletion of endogenous SUMO-1 protein by RNAi had reduced survival after exposure to this form of in vitro ischemia and an attenuated protective response to preconditioning. These findings suggest that maintenance of a globally elevated SUMO-1 (and maybe SUMO-2/3) conjugation level as revealed by immunoblot assays is a component of ischemic tolerance.


Figures

Fig. 1
Fig. 1
Preconditioning (PC) of cultured rat cortical neurons made these cells more resistant to a harmful OGD. Cortical neurons were subjected to a brief OGD (30 min or 60 min) as preconditioning and 24 h later to a harmful OGD (4 h). After 16 h ROG, cell death was assessed. (a) Representative fields of cortical neuronal culture subjected to the various conditions indicated and stained with Hoechst 33342 and PI. In the center inset, nuclear stains show examples of live cells designated by arrowheads and dead cells shown by thin arrows. (b) Quantitative data of cell death (total apoptotic and necrotic) shown as percentage of total cell population in different experimental conditions (left panel) and by LDH release as percentage of total LDH (right panel). Data are shown as means ± SD (n = 4). **p < 0.01, *p < 0.05 compared with cells subjected to a harmful OGD without PC.
Fig. 2
Fig. 2
SUMO-1 and SUMO-2/3 conjugation levels in rat cortical neurons during OGD. SUMO-1 (left panel) and SUMO-2/3 (right panel) protein levels (conjugates indicated by a long vertical double ended arrow and the free form indicated by a short horizontal arrow around 16 kDa) were analyzed in the total cell extracts from rat cortical neurons right after OGD treatment for 0, 2, 4 and 6 h with (filled circle) or without (open circle) preconditioning (PC) (60 min OGD). Upper panels are representative PAGE/WB pictures and lower panels are quantitative analyses of densities of conjugates and free forms. Data are shown as means ± SD (n = 3). Jonckheere-Terpstra tests were applied in order to analyze trends in SUMOylation levels during OGD. p values are indicated on the figure.
Fig. 3
Fig. 3
SUMO-1 and SUMO-2/3 conjugation levels in rat cortical neurons during ROG after a harmful OGD. SUMO-1 (left panel) and SUMO-2/3 (right panel) protein levels were analyzed in the total cell extracts from rat cortical neurons treated as follows with or without PC: a, control; b, OGD 4 h; c, OGD 4 h followed by 1 h ROG; d, OGD 4 h followed by 8 h ROG. Upper panels are representative PAGE/WB pictures and lower panels are quantitative analyses of the densities of conjugates and free forms. Open circles designate without PC and filled circles designate with PC. Data are shown as means ± SD (n = 3). Jonckheere-Terpstra tests were applied in order to analyze trends in SUMOylation levels during OGD. p values are indicated on the figure.
Fig. 4
Fig. 4
Over-expression of SUMO-1 and SUMO-2 made SHSY5Y cells more resistant to OGD. (a) SUMO-1 (left panel) and SUMO-2/3 (right panel) protein levels were analyzed in total cell extracts from stable SUMO-1, -2 or -3 transfectants grown in the presence (+) or the absence (−) of tetracycline (1 μM). Upper panels are representative PAGE/WB pictures and lower panels are quantitative analyses of densities of conjugates (solid bars) and free forms (striped bars). Data are shown as means ± SD (n = 4). **p < 0.01, *p < 0.05 compared with endogenous levels. (b) The three transfectants along with their parent cells were subjected to OGD (12 h) in the presence of tetracycline, and cell deaths during OGD (without ROG) were measured by nuclear staining with Hoechst 33342 and PI followed by FACS analysis. Data are shown as means ± SD (n = 6). **p < 0.01, *p < 0.05 compared with parent cells.
Fig. 5
Fig. 5
The depletion of SUMO-1 made SHSY5Y cells more sensitive to OGD/ROG and the cells that were depleted of SUMO-1 were not protected by preconditioning. (a) SUMO-1 (left panel) and SUMO-2/3 (right panel) protein levels in total cell lysates from SHSY5Y cells transfected with various shRNA constructs as follows: 1, empty vector; 2, SUMO-1 sh#2; 3, SUMO-2 sh#1; 4, SUMO-2 sh#1 plus SUMO-3 sh#1; 5, SUMO-2 sh#1 plus SUMO-3 sh#2; 6, SUMO-2 sh#1 plus SUMO-3 sh#3. Upper panel: a representative PAGE/WB picture, lower panels: quantitative analyses; solid bars:conjugates; striped bar: free forms. Data are shown as means ± SD (n = 6). **p < 0.01, *p < 0.05 compared with endogenous levels. (b) Sensitivities to OGD/ROG among shRNA transfected SHSY5Y cells. Data here are shown as means ± SD (n = 6). **p < 0.01 compared with the cells transfected with empty vector. (c) SHSY5Y cells transfected with empty vector or SUMO-1 sh#2 were subjected to a harmful OGD/ROG with or without preconditioning (4 h OGD), and assayed for cell death. Cell death in control and PC alone are also included. Data are shown as means ± SD (n = 3).
Fig. 6
Fig. 6
Over-expression of SUMO-1 made rat cortical neurons more resistant to OGD. (a) Transfection efficiency (GFP-positive cells over total cell population) (left panel), and viability (right panel).V: viable cells. (b) SUMO-1 (left panel) and SUMO-2/3 (right panel) protein levels in total cell extracts from various transfectants. Upper panels: PAGE/WB, lower panels: quantitative analyses. Data are shown as means ± SD (n = 4). **p < 0.01 compared with endogenous levels. (c) Representative pseudocolored dot-density plots of FACS analysis for various transfectants that had been subjected to OGD/ROG. Identity of transfectant and the percentage of viable cells are written in each dot gram. (d) Sensitivity to OGD/ROG among transfectants. Cell death (%) during OGD was calculated as follows: [Control live (%)−OGD live (%)]/control live (%) ×100. Data are shown as means ± SD (n = 4). *p < 0.05 compared with control (Lac Z-transfected) cells.
Fig. 7
Fig. 7
The down-regulation of SUMO-1 made mouse cortical neurons more sensitive to OGD/ROG and the SUMO-1-depleted neurons show reduced protection by preconditioning. (a) SUMO-1 (left panel) and SUMO-2/3 (right panel) protein levels in total cell lysates from mouse cortical neurons treated with various siRNAs. Upper panels: representative PAGE/WB pictures. Lower panels: quantitative analyses of densities. Data are shown as means ± SD (n = 3). (b) Sensitivities to OGD/ROG among siRNA-treated cells. Cell death was measured with Hoechst 33342 and PI followed by FACS analysis. Data here are shown as means ± SD (n = 3). (c) Mouse cortical neurons that had been transfected with AllStar siRNA or SUMO-1 siRNA were subjected to a harmful OGD/ROG with or without preconditioning (30 min OGD). Cell deaths were measured as mentioned above. Data here are shown as means ± SD (n = 3).

References

    1. Carey HV, Andrews MT, Martin SL. Mammalian hibernation: cellular and molecular responses to depressed metabolism and low temperature. Physiol Rev. 2003;83:1153–1181. - PubMed
    1. Cheng J, Kang X, Zhang S, Yeh ET. SUMO-specific protease 1 is essential for stabilization of HIF1alpha during hypoxia. Cell. 2007;131:584–595. - PMC - PubMed
    1. Chinnadurai G. Transcriptional regulation by C-terminal binding proteins. Int J Biochem Cell Biol. 2007;39:1593–1607. - PubMed
    1. Cimarosti H, Lindberg C, Bomholt SF, Ronn LC, Henley JM. Increased protein SUMOylation following focal cerebral ischemia. Neuropharmacology. 2008;54:280–289. - PubMed
    1. Dirnagl U, Simon RP, Hallenbeck JM. Ischemic tolerance and endogenous neuroprotection. Trends Neurosci. 2003;26:248–254. - PubMed

Publication types