

A genome-wide survey of the prevalence and evolutionary forces acting on human nonsense SNPs
- PMID: 19200524
- PMCID: PMC2668024
- DOI: 10.1016/j.ajhg.2009.01.008
A genome-wide survey of the prevalence and evolutionary forces acting on human nonsense SNPs
Abstract
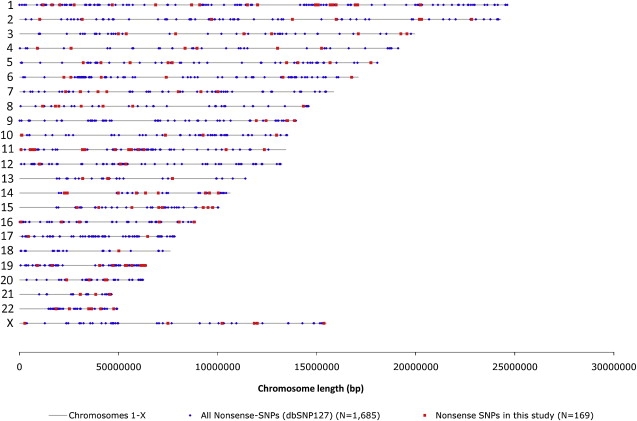
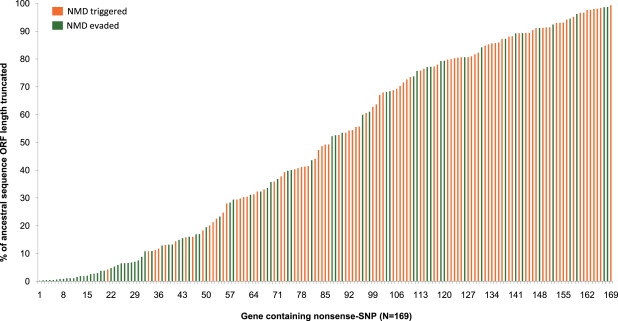
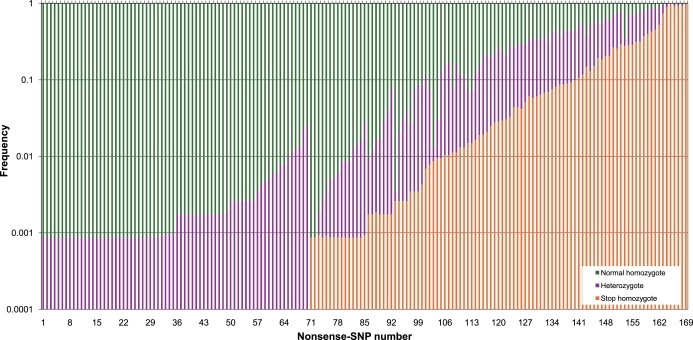
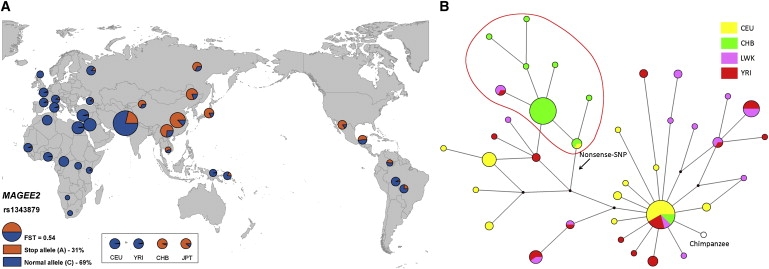
Nonsense SNPs introduce premature termination codons into genes and can result in the absence of a gene product or in a truncated and potentially harmful protein, so they are often considered disadvantageous and are associated with disease susceptibility. As such, we might expect the disrupted allele to be rare and, in healthy people, observed only in a heterozygous state. However, some, like those in the CASP12 and ACTN3 genes, are known to be present at high frequencies and to occur often in a homozygous state and seem to have been advantageous in recent human evolution. To evaluate the selective forces acting on nonsense SNPs as a class, we have carried out a large-scale experimental survey of nonsense SNPs in the human genome by genotyping 805 of them (plus control synonymous SNPs) in 1,151 individuals from 56 worldwide populations. We identified 169 genes containing nonsense SNPs that were variable in our samples, of which 99 were found with both copies inactivated in at least one individual. We found that the sampled humans differ on average by 24 genes (out of about 20,000) because of these nonsense SNPs alone. As might be expected, nonsense SNPs as a class were found to be slightly disadvantageous over evolutionary timescales, but a few nevertheless showed signs of being possibly advantageous, as indicated by unusually high levels of population differentiation, long haplotypes, and/or high frequencies of derived alleles. This study underlines the extent of variation in gene content within humans and emphasizes the importance of understanding this type of variation.
Figures
References
-
- Ohno S. Springer; Berlin: 1970. Evolution by Gene Duplication.
-
- Cartegni L., Chew S.L., Krainer A.R. Listening to silence and understanding nonsense: Exonic mutations that affect splicing. Nat. Rev. Genet. 2002;3:285–298. - PubMed
-
- Maquat L.E. Nonsense-mediated mRNA decay: splicing, translation and mRNP dynamics. Nat. Rev. Mol. Cell Biol. 2004;5:89–99. - PubMed
Publication types
MeSH terms
Substances
Grants and funding
LinkOut - more resources
Full Text Sources
Other Literature Sources
Research Materials