Cerebral blood volume in Alzheimer's disease and correlation with tissue structural integrity
- PMID: 19200623
- PMCID: PMC2888620
- DOI: 10.1016/j.neurobiolaging.2008.12.010
Cerebral blood volume in Alzheimer's disease and correlation with tissue structural integrity
Abstract
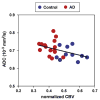
A vascular component is increasingly recognized as important in Alzheimer's disease (AD). We measured cerebral blood volume (CBV) in patients with probable AD or Mild Cognitive Impairment (MCI) and in elderly non-demented subjects using a recently developed Vascular-Space-Occupancy (VASO) MRI technique. While both gray and white matters were examined, significant CBV deficit regions were primarily located in white matter, specifically in frontal and parietal lobes, in which CBV was reduced by 20% in the AD/MCI group. The regions with CBV deficit also showed reduced tissue structural integrity as indicated by increased apparent diffusion coefficients, whereas in regions without CBV deficits no such correlation was found. Subjects with lower CBV tended to have more white matter lesions in FLAIR MRI images and showed slower psychomotor speed. These data suggest that the vascular contribution in AD is primarily localized to frontal/parietal white matter and is associated with brain tissue integrity.
Copyright © 2008 Elsevier Inc. All rights reserved.
Conflict of interest statement
Figures


Similar articles
-
Cerebral blood flow is an earlier indicator of perfusion abnormalities than cerebral blood volume in Alzheimer's disease.J Cereb Blood Flow Metab. 2014 Apr;34(4):654-9. doi: 10.1038/jcbfm.2013.241. Epub 2014 Jan 15. J Cereb Blood Flow Metab. 2014. PMID: 24424381 Free PMC article.
-
Comparison of positron emission tomography, cognition, and brain volume in Alzheimer's disease with and without severe abnormalities of white matter.J Neurol Neurosurg Psychiatry. 1996 Feb;60(2):158-67. doi: 10.1136/jnnp.60.2.158. J Neurol Neurosurg Psychiatry. 1996. PMID: 8708645 Free PMC article.
-
Evaluation of white matter damage in patients with Alzheimer's disease and in patients with mild cognitive impairment by using diffusion tensor imaging.Radiol Med. 2008 Sep;113(6):915-22. doi: 10.1007/s11547-008-0286-1. Epub 2008 Jul 10. Radiol Med. 2008. PMID: 18618077
-
Diffusion tensor imaging in Alzheimer's disease and mild cognitive impairment.Behav Neurol. 2009;21(1):39-49. doi: 10.3233/BEN-2009-0234. Behav Neurol. 2009. PMID: 19847044 Free PMC article. Review.
-
Regional grey matter loss and brain disconnection across Alzheimer disease evolution.Curr Med Chem. 2011;18(16):2452-8. doi: 10.2174/092986711795843263. Curr Med Chem. 2011. PMID: 21568913 Review.
Cited by
-
Absolute arterial cerebral blood volume quantification using inflow vascular-space-occupancy with dynamic subtraction magnetic resonance imaging.J Cereb Blood Flow Metab. 2010 Jul;30(7):1329-42. doi: 10.1038/jcbfm.2010.16. Epub 2010 Feb 10. J Cereb Blood Flow Metab. 2010. PMID: 20145656 Free PMC article.
-
Validation of VASO cerebral blood volume measurement with positron emission tomography.Magn Reson Med. 2011 Mar;65(3):744-9. doi: 10.1002/mrm.22667. Epub 2010 Dec 2. Magn Reson Med. 2011. PMID: 21337407 Free PMC article.
-
Is the cerebellum the optimal reference region for intensity normalization of perfusion MR studies in early Alzheimer's disease?PLoS One. 2013 Dec 27;8(12):e81548. doi: 10.1371/journal.pone.0081548. eCollection 2013. PLoS One. 2013. PMID: 24386081 Free PMC article.
-
Cerebral blood flow is an earlier indicator of perfusion abnormalities than cerebral blood volume in Alzheimer's disease.J Cereb Blood Flow Metab. 2014 Apr;34(4):654-9. doi: 10.1038/jcbfm.2013.241. Epub 2014 Jan 15. J Cereb Blood Flow Metab. 2014. PMID: 24424381 Free PMC article.
-
Increased cerebral blood volume in small arterial vessels is a correlate of amyloid-β-related cognitive decline.Neurobiol Aging. 2019 Apr;76:181-193. doi: 10.1016/j.neurobiolaging.2019.01.001. Epub 2019 Jan 10. Neurobiol Aging. 2019. PMID: 30738323 Free PMC article.
References
-
- Alsop DC, Detre JA, Grossman M. Assessment of cerebral blood flow in Alzheimer's disease by spin-labeled magnetic resonance imaging. Ann Neurol. 2000;47:93–100. - PubMed
-
- Ashburner J, Friston KJ. Voxel-based morphometry—the methods. Neuroimage. 2000;11:805–821. - PubMed
-
- Bartenstein P, Minoshima S, Hirsch C, Buch K, Willoch F, Mosch D, Schad D, Schwaiger M, Kurz A. Quantitative assessment of cerebral blood flow in patients with Alzheimer's disease by SPECT. J Nucl Med. 1997;38:1095–1101. - PubMed
-
- Brant-Zawadzki M, Gillan GD, Nitz WR. MP RAGE: a three-dimensional, T1-weighted, gradient-echo sequence—initial experience in the brain. Radiology. 1992;182:769–775. - PubMed
Publication types
MeSH terms
Grants and funding
LinkOut - more resources
Full Text Sources
Other Literature Sources
Medical

