. 2009 Feb 6;4(2):129-40.
doi: 10.1016/j.stem.2008.11.015.

Hierarchical maintenance of MLL myeloid leukemia stem cells employs a transcriptional program shared with embryonic rather than adult stem cells

Affiliations

Hierarchical maintenance of MLL myeloid leukemia stem cells employs a transcriptional program shared with embryonic rather than adult stem cells

Tim C P Somervaille et al. Cell Stem Cell. .

Abstract

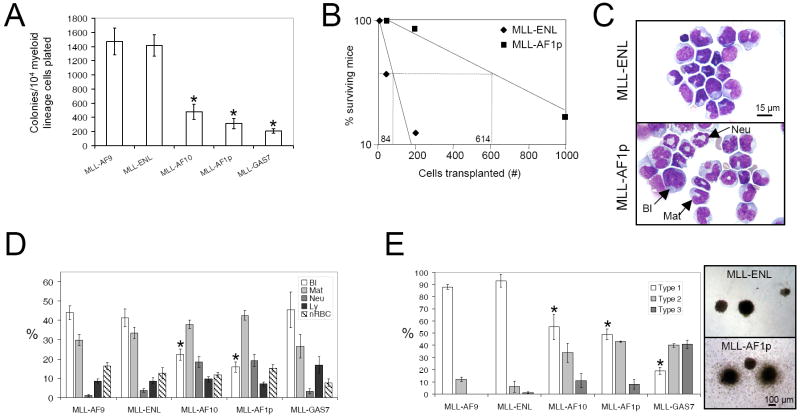
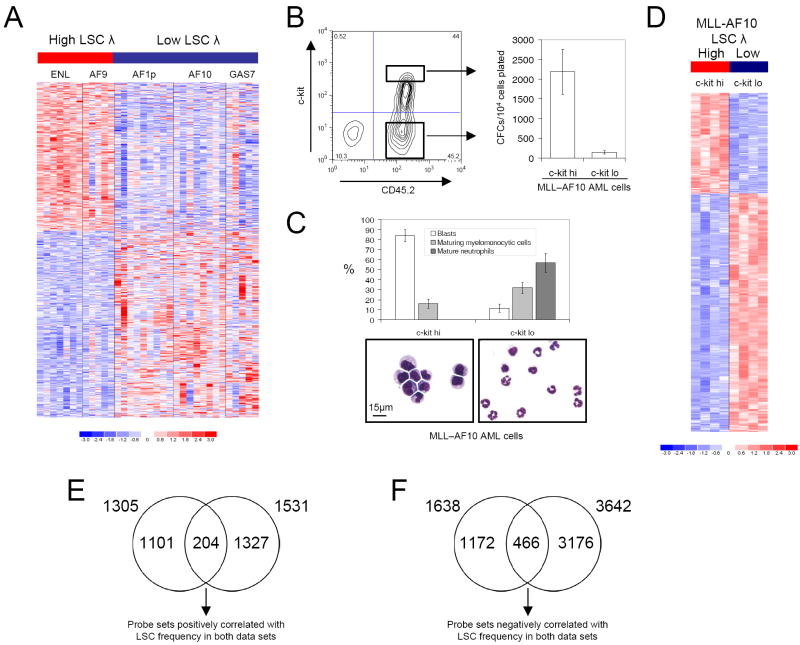
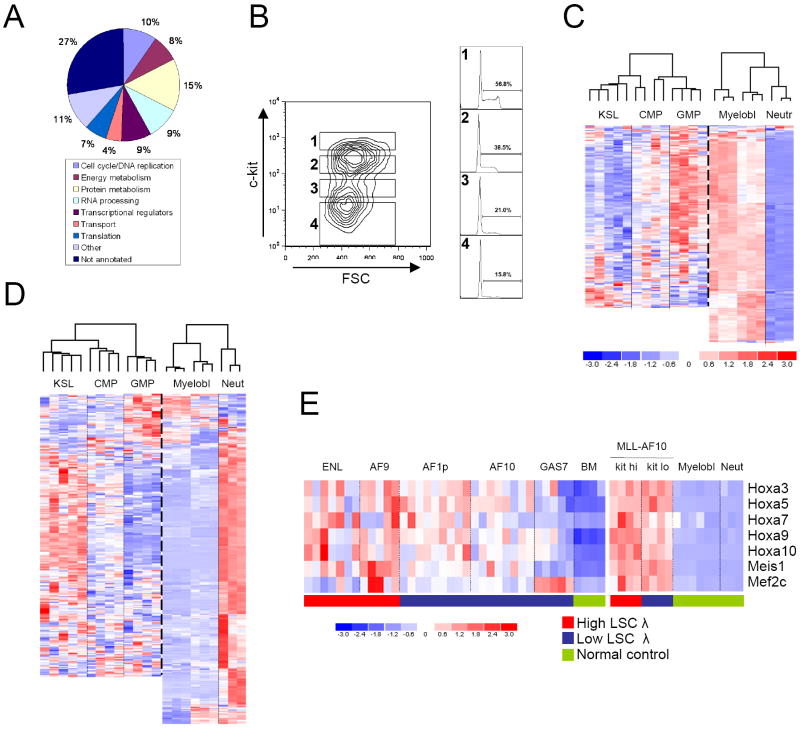
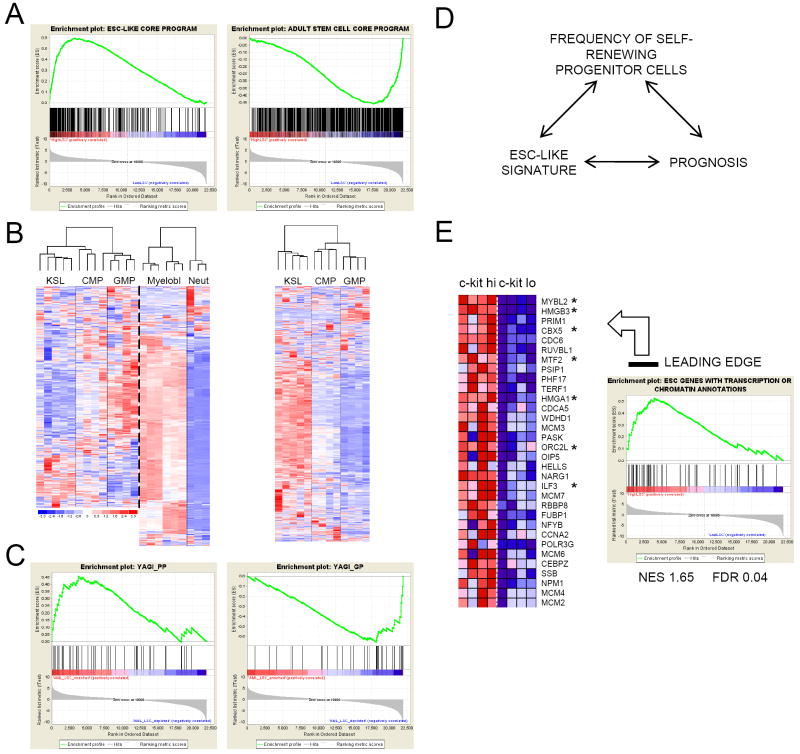
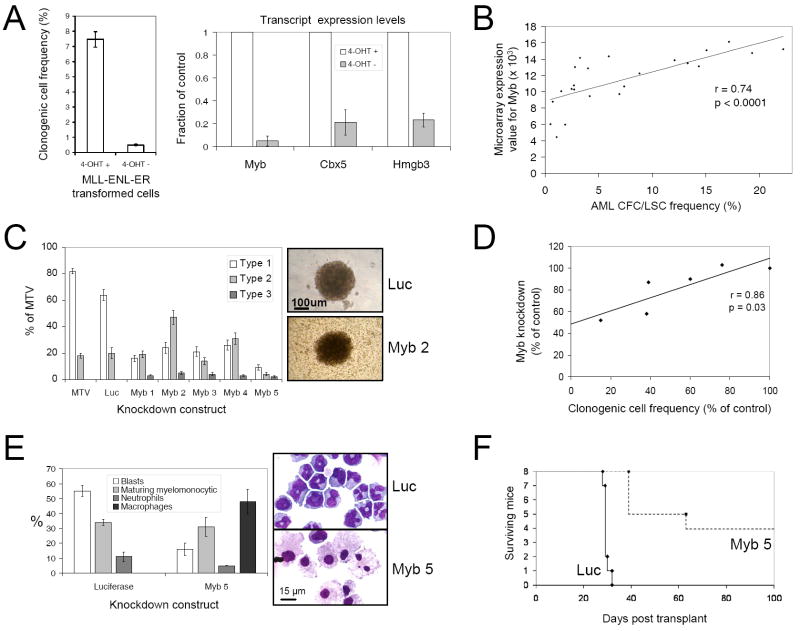
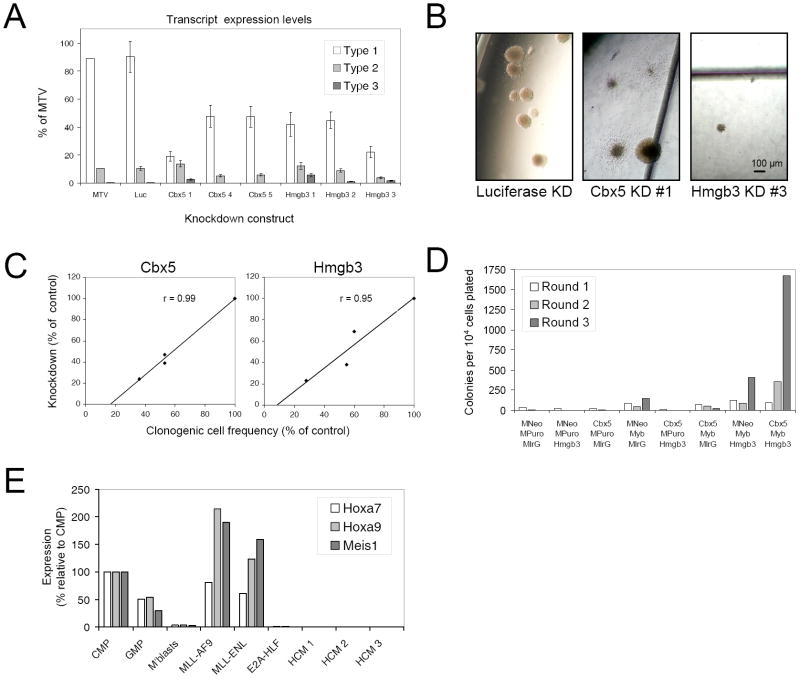
The genetic programs that promote retention of self-renewing leukemia stem cells (LSCs) at the apex of cellular hierarchies in acute myeloid leukemia (AML) are not known. In a mouse model of human AML, LSCs exhibit variable frequencies that correlate with the initiating MLL oncogene and are maintained in a self-renewing state by a transcriptional subprogram more akin to that of embryonic stem cells (ESCs) than to that of adult stem cells. The transcription/chromatin regulatory factors Myb, Hmgb3, and Cbx5 are critical components of the program and suffice for Hoxa/Meis-independent immortalization of myeloid progenitors when coexpressed, establishing the cooperative and essential role of an ESC-like LSC maintenance program ancillary to the leukemia-initiating MLL/Hox/Meis program. Enriched expression of LSC maintenance and ESC-like program genes in normal myeloid progenitors and poor-prognosis human malignancies links the frequency of aberrantly self-renewing progenitor-like cancer stem cells (CSCs) to prognosis in human cancer.


Figures

Figure 1
Figure 1. Variable LSC frequencies and cellular hierarchies in murine AMLs induced by different MLL oncogenes
(A) Bar graph shows frequency of colony forming cells (CFCs) in the spleens of leukemic mice (mean ±SEM; n=7 leukemias for each fusion, except MLL-GAS7 where n=11; * represents p≤0.001 by comparison with MLL-AF9). (B) Limit dilution analyses show the estimated number of secondarily transplanted leukemic MLL-ENL or MLL-AF1p splenocytes required to initiate AML in sub-lethally irradiated recipient mice (n=8 recipients for each cell dose). Mice were followed for 180 days, with the longest disease latencies being 66 days for MLL-ENL and 67 days for MLL-AF1p. (C) In representative bone marrow cytospin images, MLL-AF1p initiated AML cells are more differentiated by comparison with MLL-ENL initiated AML cells. Scale bar applies to both images. (D) Bar graph shows percentage cell type in spleen as determined by morphologic analysis of cytospin preparations (mean ±SEM; n=8-13 for each cohort; * represents p≤0.05 for blast cell percentage versus MLL-AF9). Bl, blast cell; Mat, maturing myelomonocytic cell; Neu, neutrophil; Ly, lymphocyte; nRBC, nucleated erythroid precursor cell. (E) Bar graph shows proportion of myeloid leukemia colonies of each morphologic type (defined in Lavau et al., 1997) (mean ±SEM; n=3-5 separate leukemias for each fusion; * represents p<0.05 by comparison with MLL-AF9 for Type 1 colony frequency). Representative images are shown on the right. Scale bar applies to both images.
Figure 2
Figure 2. Derivation of an MLL LSC maintenance signature
(A) Image represents the 2943 probe sets differentially expressed between 12 high LSC frequency AMLs (MLL-ENL and MLL-AF9) and 22 low LSC frequency AMLs (MLL-AF1p, MLL-AF10 and MLL-GAS7). Color scale indicates normalized expression values. (B) MLL-AF10 leukemic splenocytes were FACS sorted for high or low level c-kit expression, as indicated in the representative plot. Bar graph shows clonogenic potentials of the sorted sub-populations in semi-solid culture (mean ±SEM; n=4). AML was initiated by transplantation of immortalized CD45.2+ c-kit+ BM stem and progenitor cells. (C) Bar graph and representative images show morphology of sorted leukemia cell populations (mean ± SEM; n=4). Scale bar applies to both images. (D) Image represents the 5173 probe sets differentially expressed between high LSC frequency (c-kithi) and low LSC frequency (c-kit-) MLL-AF10 leukemia cell sub-populations. Color scale indicates normalized expression values. (E & F) Venn diagrams show the intersection of probe sets positively (E) and negatively (F) correlated with LSC frequency from the analyses shown in panels A and D.
Figure 3
Figure 3. Biologic features of MLL LSCs
(A) Gene ontology analysis of genes within the LSC maintenance signature based on their biologic process annotations. (B) Mac1+ splenocytes from a mouse with MLL-AF9 AML were FACS sorted using the gates indicated in the representative plot. Sorted cells within each fraction were then analyzed for their cell cycle status (right hand plots). (C & D) Unsupervised cluster analysis of the expression patterns of LSC maintenance signature genes positively (C) or negatively (D) correlated with LSC function, in defined populations of normal hematopoietic cells. Values from KSL, CMP and GMP cells (Krivtsov et al., 2006) and normal myeloblasts and neutrophils (this study) were utilized. Not all of the genes in the signature are represented on the Affymetrix 430A 2.0 chip used by Krivtsov et al. Color scale applies to both images and represents normalized expression values. (E) Heat map shows expression of Hoxa, Meis1 and Mef2c genes in microarray analyses of MLL leukemias with high or low frequencies of LSCs (left panel), and in sorted sub-populations of MLL-AF10 leukemias with high (c-kithi) or low (c-kitlo) frequencies of LSCs (right panel). Expression values for whole bone marrow (left panel) and prospectively isolated normal myeloblasts or neutrophils (right panel) are shown for comparison (Normal control).
Figure 4
Figure 4. Shared transcriptional features of MLL LSCs, ESCs, normal myeloid progenitors and poor prognosis human malignancies, including pediatric leukemia
(A) GSEA plots show that expression of an ESC-like core gene module (Wong et al., 2008; Supplemental Table 9) is enriched in high (c-kithi) vs low (c-kitlo) LSC frequency MLL-AF10 leukemia cell populations (left panel), whereas the reverse correlation is observed for an adult tissue stem cell module (right panel). (B) Unsupervised cluster analysis of the expression pattern of ESC-like core module genes (left panel) and adult tissue stem cell module genes (right panel) (Wong et al., 2008) in the indicated defined populations of normal hematopoietic cells (Krivtsov et al., 2006 and this study). Color scale indicates normalized expression values. (C) GSEA plots show expression of poor prognosis genes in pediatric myeloid leukemia (Yagi et al., 2003; Supplemental Table 9) is enriched in high (c-kithi) vs low (c-kitlo) LSC frequency MLL-AF10 leukemia cell populations (left panel), whereas the reverse correlation is observed for good prognosis genes (right panel). (D) Suggested link between an ESC-like transcriptional signature, prognosis and cancer stem cell frequency in human malignancy. (E) Leading edge analysis of GSEA plot shows enriched expression of ESC-like genes with transcription or chromatin annotations (Ben-Porath et al., 2008; Supplemental Table 9) in high (c-kithi) vs low (c-kitlo) LSC frequency MLL-AF10 leukemia cell populations. Those marked with an asterisk, or their close homologues, are found within the LSC maintenance signature.
Figure 5
Figure 5. Myb is a critical component of the MLL LSC maintenance signature
(A) Bar graph (left panel) shows clonogenic potentials of c-kit+ bone marrow stem and progenitor cells transformed by MLL-ENL-ER and then cultured in the presence or absence of 4-OHT for seven days (mean ±SEM; n=4). Bar graph (right panel) shows expression of Myb, Cbx5 and Hmgb3 transcripts in cells deprived of 4-OHT by comparison with control cells exposed to 4-OHT (mean ±SEM; n=4). (B) Graph shows that Myb transcript levels (microarray expression value) correlate significantly with LSC frequencies (see Figure 1A) within individual leukemias (n=23 separate leukemias; n=3-6 for each of the five MLL molecular subtypes in this study). (C) Bar graph shows CFC potentials of MLL-ENL AML cells transduced with lentiviruses containing shRNA constructs targeting Myb or Luciferase transcripts, by comparison with control cells transduced with an empty lentivirus (MTV), stratified by colony types (indicated in the representative images; mean ±SEM; n=4). Transduced AML cells were FACS sorted for mCherry expression 48 hours following lentiviral transduction. (D) Graph demonstrates that the extent of Myb knockdown measured by quantitative PCR in transduced cells 48 hours following lentiviral transduction correlated significantly with the inhibition of AML CFC/LSC formation for each of the five Myb knockdown constructs. (E) Bar graph (mean±SEM; n=4) and representative images show morphologic analysis of Myb knockdown and control MLL-ENL AML cells 48 hours following transduction. (F) Survival curves of sub-lethally irradiated syngeneic mice transplanted with 2.5-25×104 MLL-ENL AML cells transduced with lentiviruses targeting Myb or Luciferase expression.
Figure 6
Figure 6. Requirement of Hmgb3 and Cbx5 for the cooperative maintenance of MLL LSC potentials
(A & B) Bar graph shows clonogenic/LSC potentials (mean ±SEM) of MLL-ENL AML cells transduced with lentiviruses containing shRNA constructs targeting Cbx5, Hmgb3 or Luciferase expression, by comparison with control cells transduced with an empty lentivirus (MTV). Transduced AML cells were FACS sorted for mCherry expression 48 hours following lentiviral infection. Colony types are indicated (A) and representative images are shown (B). Scale bar applies to all images. (C) Graphs demonstrate that the extent of Cbx5 and Hmgb3 knockdown measured by quantitative PCR in transduced cells 48 hours following lentiviral transduction correlated with the inhibition of AML-CFC/LSC potential. (D) Bar graph shows serial replating potentials of c-kit+ bone marrow stem and progenitor cells triple co-transduced with all possible combinations of Myb, Cbx5, Hmgb3 and control viruses. MNeo – MSCV Neo; MPuro – MSCV Puro; MIrG – MSCV IRES-GFP. (E) Bar graph shows relative expression of Hoxa7, Hoxa9 and Meis1, as determined by quantitative PCR, in prospectively sorted normal murine bone marrow progenitor subsets (CMP, GMP and c-kit+ Mac1+ myeloblasts) and in c-kit+ bone marrow stem and progenitor cells immortalized by the indicated oncogenes, or co-expression of Myb, Cbx5 and Hmgb3 (HCM – 3 separate lines are shown).

Comment in

Similar articles

Cited by

References

    1. Adams JM, Kelly PN, Dakic A, Nutt SL, Strasser A. Response to Comment on “Tumor growth need not be driven by rare cancer stem cells”. Science. 2007;318:1722. - PubMed
    1. Assou S, Le Carrour T, Tondeur S, Strom S, Gabelle A, Marty S, Nadal L, Pantesco V, Reme T, Hugnot JP, et al. A meta-analysis of human embryonic stem cells transcriptome integrated into a web-based expression atlas. Stem Cells. 2007;25:961–973. - PMC - PubMed
    1. Ayton PM, Cleary ML. Transformation of myeloid progenitors by MLL oncoproteins is dependent on Hoxa7 and Hoxa9. Genes Dev. 2003;17:2298–2307. - PMC - PubMed
    1. Bannister AJ, Zegerman P, Partridge JF, Miska EA, Thomas JO, Allshire RC, Kouzarides T. Selective recognition of methylated lysine 9 on histone H3 by the HP1 chromo domain. Nature. 2001;410:120–124. - PubMed
    1. Ben-Porath I, Thomson MW, Carey VJ, Ge R, Bell GW, Regev A, Weinberg RA. An embryonic stem cell-like gene expression signature in poorly differentiated aggressive human tumors. Nat Genet. 2008;40:499–507. - PMC - PubMed

Publication types

MeSH terms