. 2009 Feb 6;4(2):155-69.
doi: 10.1016/j.stem.2008.12.009.

A two-step mechanism for stem cell activation during hair regeneration

Affiliations

A two-step mechanism for stem cell activation during hair regeneration

Valentina Greco et al. Cell Stem Cell. .

Erratum in

  • Cell Stem Cell. 2009 May 8;4(5):464

Abstract

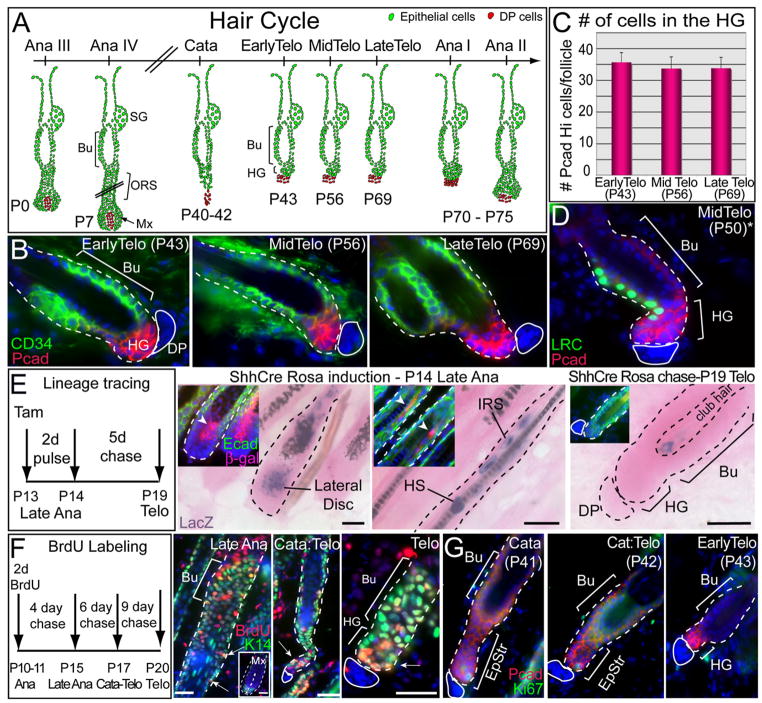
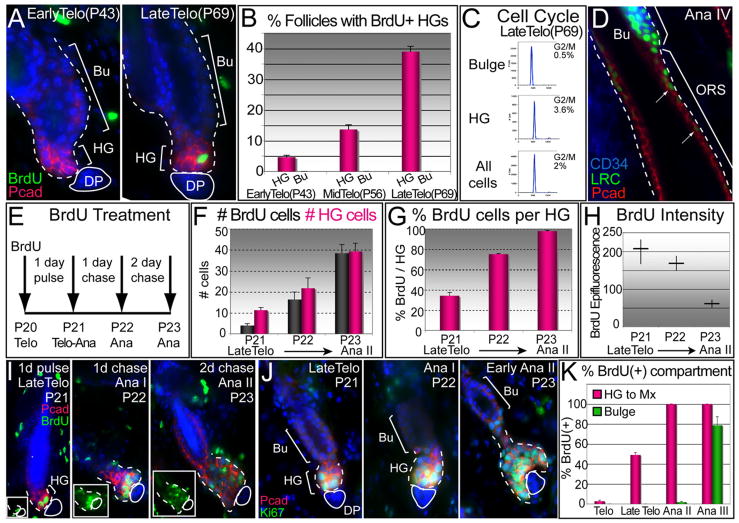
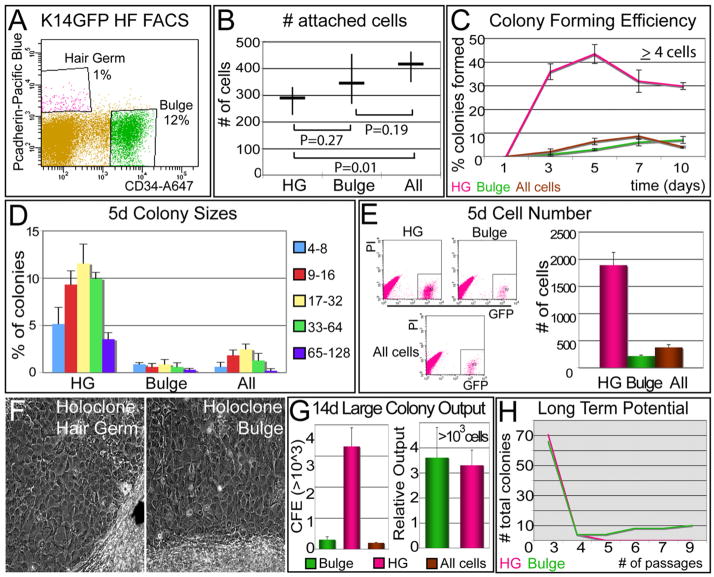
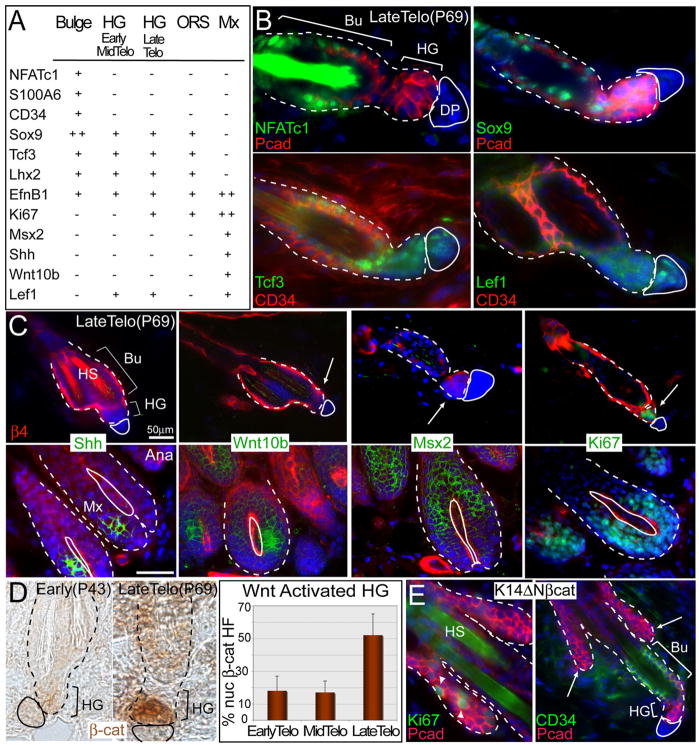
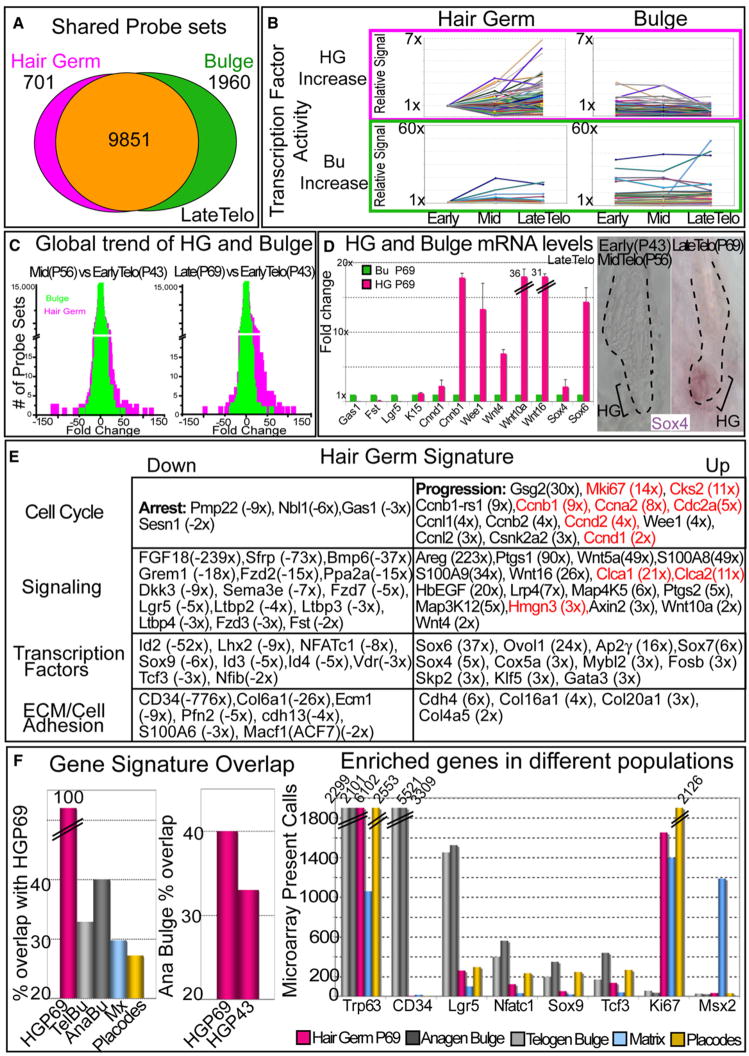
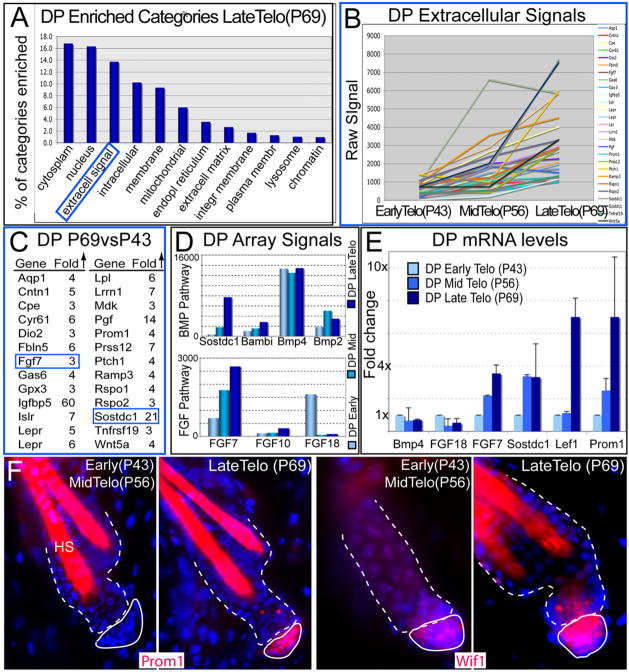
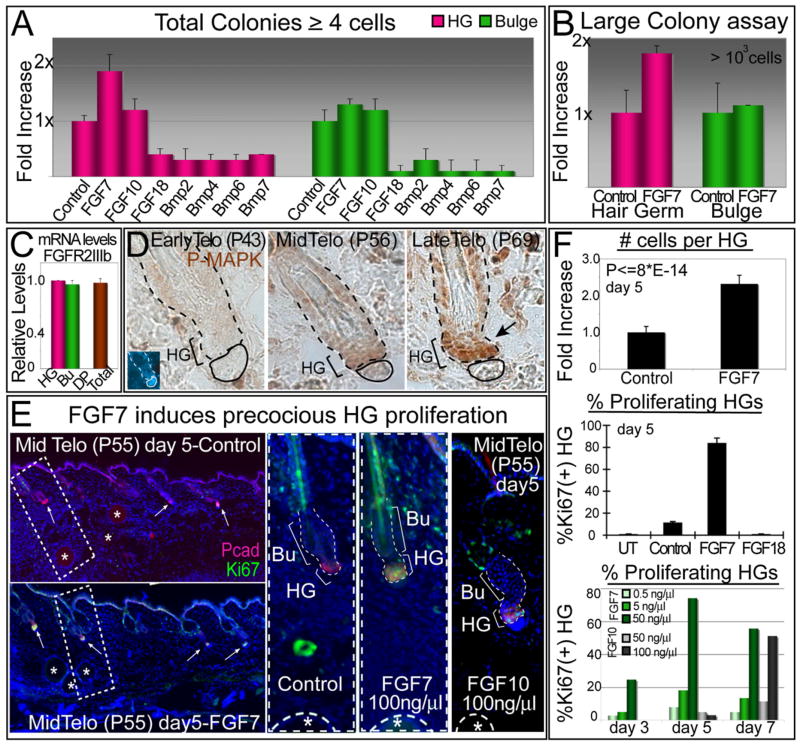
Hair follicles (HFs) undergo cyclic bouts of degeneration, rest, and regeneration. During rest (telogen), the hair germ (HG) appears as a small cell cluster between the slow-cycling bulge and dermal papilla (DP). Here we show that HG cells are derived from bulge stem cells (SCs) but become responsive quicker to DP-promoting signals. In vitro, HG cells also proliferate sooner but display shorter-lived potential than bulge cells. Molecularly, they more closely resemble activated bulge rather than transit-amplifying (matrix) cells. Transcriptional profiling reveals precocious activity of both HG and DP in late telogen, accompanied by Wnt signaling in HG and elevated FGFs and BMP inhibitors in DP. FGFs and BMP inhibitors participate with Wnts in exerting selective and potent stimuli to the HG both in vivo and in vitro. Our findings suggest a model where HG cells fuel initial steps in hair regeneration, while the bulge is the engine maintaining the process.


Figures

Figure 1
Figure 1. The HG Forms at the Catagen-to-Telogen Transition but Does Not Originate from the Shh-Expressing Lateral Disc
(A) Schematic of the hair cycle. Timing is based upon CD1 mice. Anagen is subdivided into six stages according to Muller-Rover et al. (2001). Hair germs (HGs) emerge at the end of the first catagen and exist as a distinct entity during telogen. Bu, bulge; SG, sebaceous gland; ORS, outer root sheath; Mx, matrix. (B) HG and bulge are distinguished by immunofluorescence for enrichment of P-cadherin (Pcad, HG) and CD34 (Bu) and by proximity to the dermal papilla (DP), denoted by the solid white line. Note that CD34 marks dermal cells as well as bulge. (C) HG size is constant during telogen. Confocal Z stack of 100 μm thick sections revealed ~32 cells/HG. Ten representative HFs were scanned at high resolution with 40× objective at the confocal for each time point. In all graphics, data are reported as average ± SD. (D) Label-retaining cells (LRCs) are present in bulge and HG. Representative section is from H2BGFP pulse chased mouse. *Due to strain difference, mid telogen in K5Tetoff/TRE-H2BGFP mice is at P50. (E) Genetic lineage tracing using ShhCreER/Rosa-LoxP-Stop-LoxP-LacZ transgenic mice. Cre was induced with tamoxifen, and mice were analyzed at times shown for β-galactosidase activity (blue) and histology (eosin) (main frames) or Abs to β-gal (red) and Ecadherin (green) (insets). Note β-gal in lateral disc, inner root sheath (IRS), hair shaft (HS), and club hair, but not HG. (F) BrdU-label-retaining experiments. A 2 day BrdU pulse in anagen was chased for the times indicated and analyzed by immunofluorescence with K14 H2B GFP (green) and BrdU (red) Ab. Note that ORS LRCs (arrow) persist during catagen and can be found in the retracting epithelial strand. At telogen, epithelial LRCs are present in HG (arrow) and bulge. (G) Nuclear Ki67 immunofluorescence reveals that the bulge (Bu) is largely negative (dormant) during catagen and at telogen. Nuclei are marked blue.
Figure 2
Figure 2. HGs Become Activated Prior to the Bulge and Contribute to the Next Hair Cycle
(A and B) BrdU 1 day pulses were given at early, mid-, and late telogen, followed by analyses. Shown are representative images (A), quantifications compiled from two independent experiments (B). Data are reported as average ± SD. (C) Cell-cycle profile of purified late telogen populations analyzed by FACS and FlowJo Program. (D) Representative section from 10 wk K5Tetoff/TRE-H2BGFP mice chased at 4 weeks. During full anagen, LRCs (green) form a trail from the bulge along the ORS (red). Dotted white lines demarcate dermis from HF. (E–I) Short pulse-chase experiments. Late telogen P20 mice were pulsed with BrdU for 1 day to specifically mark the HG and then chased. Note the increases in BrdU(+) and HG cells per follicle in the transition from telogen to anagen (F and G), while the BrdU intensity decreased (H). Representative pictures of anti-BrdU immunofluoresences are shown in (I). (J) Ki67 immunostaining to show proliferative cells at the telogen-to-anagen transition. (K) Short BrdU pulse experiment reveals a two-step activation process: HGs become positive for BrdU by late telogen, while bulge cells remain dormant until the end of anagen II. Nuclei are marked with DAPI (blue).
Figure 3
Figure 3. HG Cells Form Large Colonies Faster than Bulge Cells, but Their Long Term Potential is Poorer In Vitro
(A) FACS profile for isolating HG and bulge cells from P69 K14H2BGFP female CD1 mice. The “All” fraction is all GFP(+). (B) 103 cells of each population were plated in quadruplicate onto 12-well plates, and 12 hr later, the numbers of attached cells were quantified. The same experiment was performed in parallel in 6-well plates with no significant differences observed. (C) Colony forming efficiency. We measured the percent (%) of attached cells that proliferated to reach a size of ≥4 cells (a colony) (Barrandon and Green, 1987). Graphs show average percentage ± SD. Note that HG cells formed colonies efficiently, but by 10 days, they began to diminish. (D and E) Colony sizes and total cell number after 5 days in vitro. Experiments were performed in quadruplicate. (F and G) Large colonies formed after 14 days in vitro. FACS-purified HG, bulge, and all GFP(+) cells were plated and monitored over 2 weeks. (F) Morphological appearance of a large (>20 mm2; 103 cells) colony formed from individual HG or bulge cells. Note tightly packed, relatively undifferentiated cells within HG and bulge colonies. (G) Left graph depicts the percent (%) large colonies formed relative to an equal number of cells plated. Right graph depicts total number of large colonies per population. Since bulge contains ~12× more cells than HG, their total output of large colonies is comparable. (H) Long-term potential. Individual large clones were dissociated and serially passaged in culture. Note that most HG clones did not survive past passage 3, even when transferred as a whole to enhance the probability of holoclone detection.
Figure 4
Figure 4. The HG Is Molecularly Distinct from Bulge, ORS, and Matrix and Displays Elevated Nuclear β-Catenin When Activated
(A) Table summarizing HG expression patterns of classical HF markers. (B and C) Confirmation of HG expression patterns by in situ hybridizations (Shh, Wnt10b, and Msx2) or immunofluorescence (rest). Arrows denote HGs. In (C), anti-β4 integrin (red) marks bulge and HG (hair shafts, HS, autofluorescence). White solid line delineates DP; dotted line denotes dermo-epithelial boundary. (D) Immunohistochemistry shows nuclear localization of β-catenin only in late telogen HGs (quantification reported as average ± SD). (E) Immunofluorescence of backskin sections of K14ΔNβcat transgenic mice expressing constitutively stabilized β-catenin. Note that ectopic de novo HFs (arrows) are proliferative (arrowheads point to Ki67+ nuclei) and enriched for HG marker P-cadherin (in red), but not bulge marker CD34 (in green right panel). Nuclei are marked with DAPI (blue).
Figure 5
Figure 5. Prior to a New Hair Cycle, HGs Are Transcriptionally More Active than the Bulge
HG and bulge cells were FACS purified from P43, P56, and P69 HFs, and their mRNAs were subjected to microarray analyses. (A) Venn diagram reveals degree of similarity between P69 HG and bulge based on absolute present calls. 701 probe sets are uniquely present in the HG and absent in the bulge; 1960 probe sets are unique to the bulge. (B) Genes in DAVID-scored enriched categories (see the Supplemental Experimental Procedures) are more dynamically expressed during telogen in the HG versus bulge. (C) Global changes in HG versus bulge expression profiles between any two time points in telogen. Note that differences are more pronounced for HG than bulge. (D and E) Array comparisons between HG and bulge define a molecular signature that distinguishes the two populations at each of the three time points throughout telogen. Shown are data for P69, where the differences are most conspicuous. Real-time PCR or in situ hybridization in (D) validates key genes of the P69 molecular signatures, summarized in (E). Data are reported as average ± SD. Genes highlighted in red are part of a shortlist whose expression is upregulated in anagen versus telogen bulge cells when the levels of stabilized β-catenin are elevated (Lowry et al., 2005). Fold differences are indicated in parentheses. (F) Comparisons between the late telogen HG array signals and those of the telogen bulge (TelBu) (Lowry et al., 2005), anagen bulge (AnaBu) (Lowry et al., 2005), matrix (Mx) (Rendl et al., 2005), and embryonic hair placode/primary hair germ (Rhee et al., 2006). Key gene array levels from each population are plotted in histograms at right. These comparisons underscore the uniqueness of the HG.
Figure 6
Figure 6. DP Cells Are Also Transcriptionally Active during the Quiescent Phase
HG, bulge and DP were simultaneously FACS purified from P43, P56 and P69 HFs and then subjected to microarray analyses. (A) Gene Ontology comparisons reveal several gene categories enriched progressively as the DP transitions through telogen. Note the extracellular signaling molecules were among the most enriched of the specialized categories. (B and C) Trend and list of DP genes belonging to the extracellular signaling category and that are upregulated (>3×) with signal values ≥1000 at late versus early telogen. (D) Microarray DP signal values of BMP and FGF pathway members, which displayed particularly prominent temporal differences across telogen. FGF7 and BMP inhibitors Sostdc1 and Bambi progressively increased in expression during telogen, in comparison to BMPs 2 and 4. (E) Real-time PCR of mRNAs from purified DP confirms the trends observed from the microarrays. Data are reported as average ± SD. (F) Immunofluorescence of Prom1 and Wif1 confirm their differential expression patterns in the DP during telogen. DAPI in blue; hair shafts (HS) are autofluorescent.
Figure 7
Figure 7. FGF7 Stands Out As a DP Effector of HG Cell Growth that Increases in Expression during Telogen
(A) In culture, FGF7 increases the total number of colonies made by HG cells. Bulge cells are affected to a lesser extent. Same assay as in Figure 3D over a course of 5 days was used to assess the effect of the various factors. (B) FGF7 displays a similar positive effect on the formation of large colonies from HG cells. (C) Real-time PCR of FGFR2 exon IIIb, specific for the FGF7/FGF10 receptor. Note presence in HG and bulge, but not DP, supportive of paracrine action. (D) Abs against phosphorylated (active) MAPK reveal signs of growth factor signaling during late telogen, concomitant with the elevation in FGF7 expression (E and F) FGF7 treatment in vivo precociously activates HG cells and induces them to proliferate. P50 CD1 mice whose HFs were in early telogen were injected with beads soaked in factors as indicated. Experiments were done ≥2 for all factors, and ~50 HFs per mouse were analyzed. After 5 days of treatment, nearly 100% of HFs were Ki67(+) and displayed enhanced numbers of cells within the HG. By contrast, HFs that were either untreated (UT) or treated with BSA (Control) or FGF18 remained dormant during telogen (middle histogram). The effects of FGF7 and FGF10 were similar with FGF7 showing more potent effects (lower histogram). In all graphics, data are reported as average ± SD.

Comment in

  • The river of stem cells.
    Chuong CM, Widelitz RB. Chuong CM, et al. Cell Stem Cell. 2009 Feb 6;4(2):100-2. doi: 10.1016/j.stem.2009.01.003. Cell Stem Cell. 2009. PMID: 19200797 Free PMC article.

References

    1. Alonso L, Okada H, Pasolli A, Wakeham A, You-Ten A, Mak T, Fuchs E. Sgk3 links growth factor signaling to maintenance of progenitor cells in the hair follicle. J Cell Biol. 2005;15:559–570. - PMC - PubMed
    1. Andl T, Ahn K, Kairo A, Chu EY, Wine-Lee L, Reddy ST, Croft NJ, Cebra-Thomas JA, Metzger D, Chambon P, et al. Epithelial Bmpr1a regulates differentiation and proliferation in postnatal hair follicles and is essential for tooth development. Development. 2004;131:2257–2268. - PubMed
    1. Barrandon Y, Green H. Three clonal types of keratinocyte with different capacities for multiplication. Proc Natl Acad Sci USA. 1987;84:2302–2306. - PMC - PubMed
    1. Blanpain C, Lowry WE, Geoghegan A, Polak L, Fuchs E. Self-renewal, multipotency, and the existence of two cell populations within an epithelial stem cell niche. Cell. 2004;118:635–648. - PubMed
    1. Botchkarev VA, Botchkareva NV, Nakamura M, Huber O, Funa K, Lauster R, Paus R, Gilchrest BA. Noggin is required for induction of the hair follicle growth phase in postnatal skin. FASEB J. 2001;15:2205–2214. - PubMed

Publication types

MeSH terms