

Improving performance of computer-aided detection scheme by combining results from two machine learning classifiers
- PMID: 19201355
- PMCID: PMC2675918
- DOI: 10.1016/j.acra.2008.08.012
Improving performance of computer-aided detection scheme by combining results from two machine learning classifiers
Abstract
Rationale and objectives: Global data-based and local instance-based machine-learning methods and classifiers have been widely used to optimize computer-aided detection and diagnosis (CAD) schemes to classify between true-positive and false-positive detections. In this study, the correlation between these two types of classifiers was investigated using a new independent testing data set, and the potential improvement of a CAD scheme's performance by combining the results of the two classifiers in detecting breast masses was assessed.
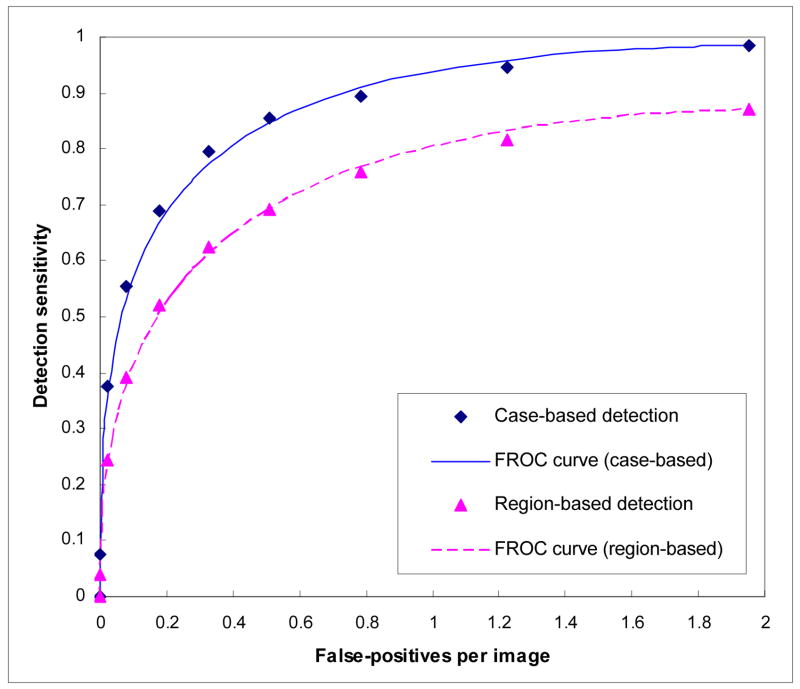
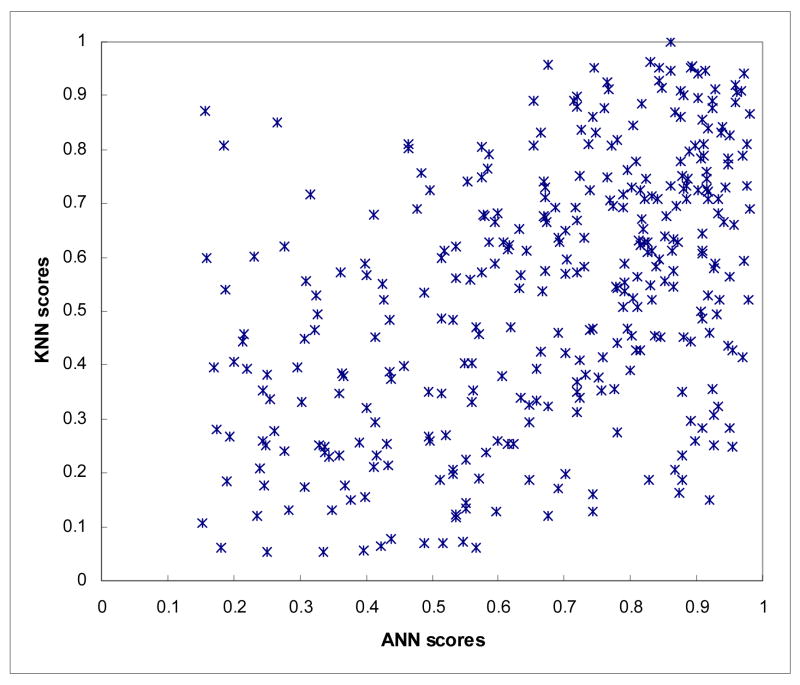
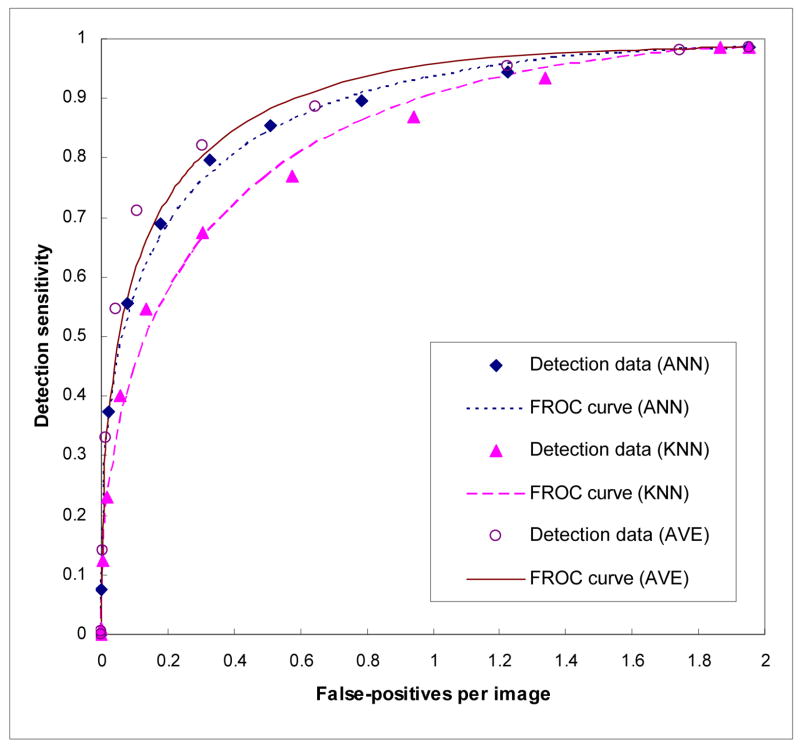
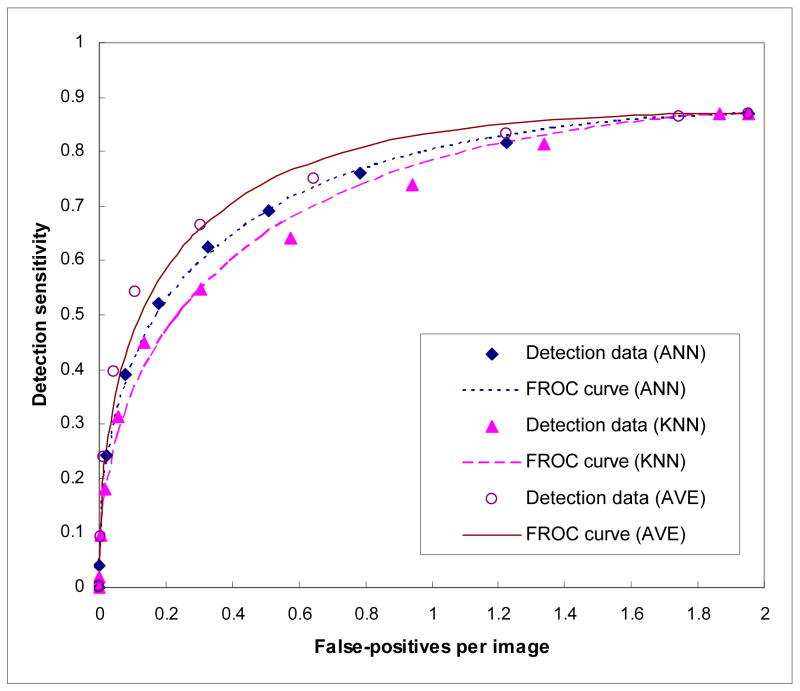
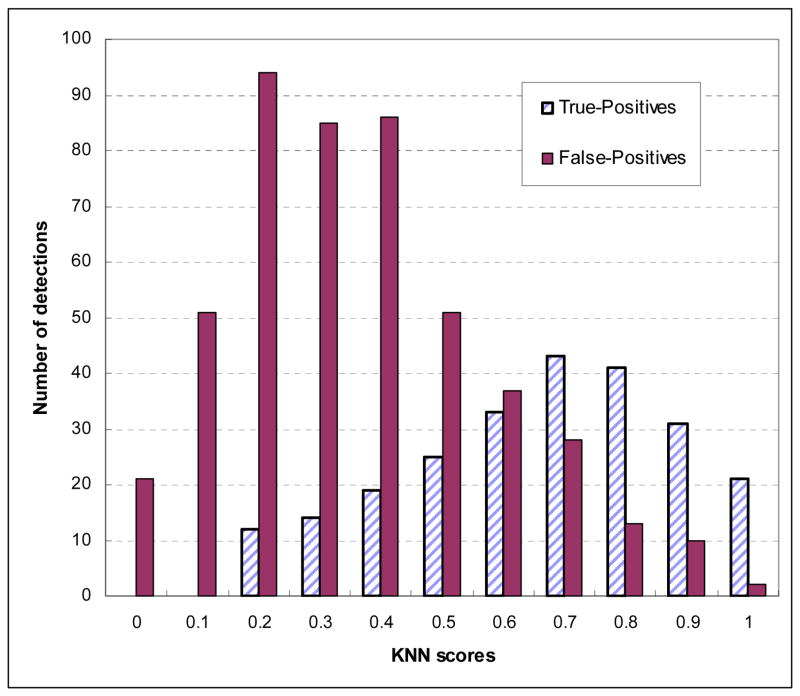
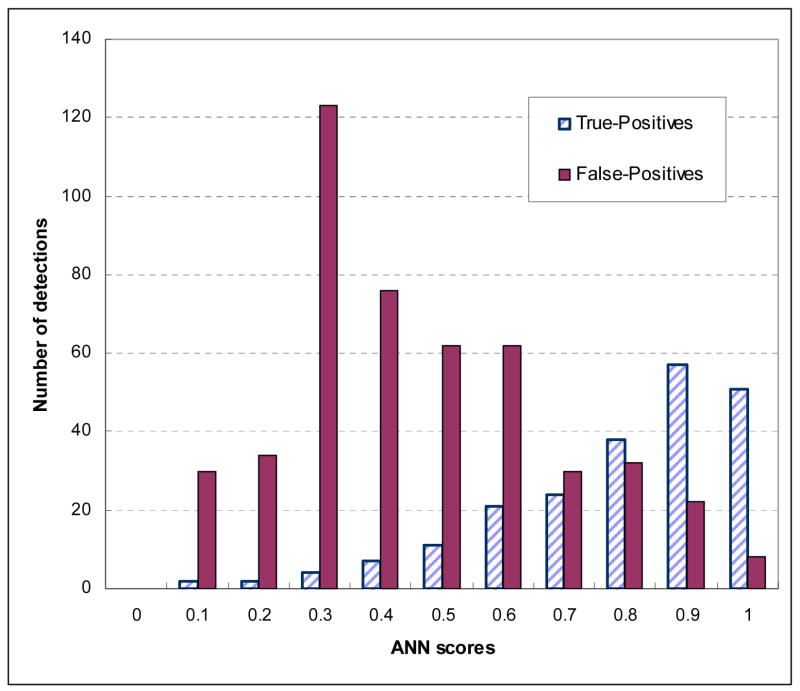
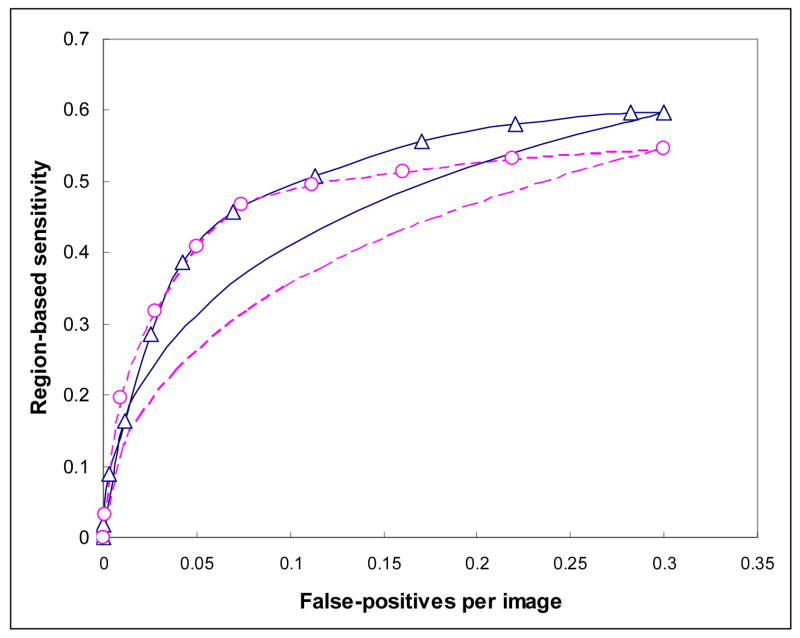
Materials and methods: The CAD scheme first used image filtering and a multilayer topographic region growth algorithm to detect and segment suspicious mass regions. The scheme then used an image feature-based classifier to classify these regions into true-positive and false-positive regions. Two classifiers were used in this study. One was a global data-based machine-learning classifier, an artificial neural network (ANN), and the other was a local instance-based machine-learning classifier, a k-nearest neighbor (KNN) algorithm. An independent image database including 400 mammographic examinations was used in this study. Of these, 200 were cancer cases and 200 were negative cases. The preoptimized CAD scheme was applied twice to the database using the two different classifiers. The correlation between the two sets of classification results was analyzed. Three sets of CAD performance results using the ANN, KNN, and average detection scores from both classifiers were assessed and compared using the free-response receiver-operating characteristic method.
Results: The results showed that the ANN achieved higher performance than the KNN algorithm, with a normalized area under the performance curve (AUC) of 0.891 versus 0.845. The correlation coefficients between the detection scores generated by the two classifiers were 0.436 and 0.161 for the true-positive and false-positive detections, respectively. The average detection scores of the two classifiers improved CAD performance and reliability by increasing the AUC to 0.912 and reducing the standard error of the estimated AUC by 14.4%. The detection sensitivity was also increased from 75.8% (ANN) and 65.9% (KNN) to 80.3% at a false-positive detection rate of 0.3 per image.
Conclusions: This study demonstrates that two global data-based and local data-based machine-learning classifiers (ANN and KNN) generated low correlated detection results and that combining the detection scores of these two classifiers significantly improved overall CAD performance (P < .01) and reduced standard error in CAD performance assessment.
Figures
Similar articles
-
Computer-aided detection; the effect of training databases on detection of subtle breast masses.Acad Radiol. 2010 Nov;17(11):1401-8. doi: 10.1016/j.acra.2010.06.009. Epub 2010 Jul 22. Acad Radiol. 2010. PMID: 20650667 Free PMC article.
-
A method to test the reproducibility and to improve performance of computer-aided detection schemes for digitized mammograms.Med Phys. 2004 Nov;31(11):2964-72. doi: 10.1118/1.1806291. Med Phys. 2004. PMID: 15587648
-
Improving performance of computer-aided detection of masses by incorporating bilateral mammographic density asymmetry: an assessment.Acad Radiol. 2012 Mar;19(3):303-10. doi: 10.1016/j.acra.2011.10.026. Epub 2011 Dec 14. Acad Radiol. 2012. PMID: 22173323 Free PMC article.
-
A review of automatic mass detection and segmentation in mammographic images.Med Image Anal. 2010 Apr;14(2):87-110. doi: 10.1016/j.media.2009.12.005. Epub 2009 Dec 29. Med Image Anal. 2010. PMID: 20071209 Review.
-
Machine Learning for Workflow Applications in Screening Mammography: Systematic Review and Meta-Analysis.Radiology. 2022 Jan;302(1):88-104. doi: 10.1148/radiol.2021210391. Epub 2021 Oct 19. Radiology. 2022. PMID: 34665034 Free PMC article.
Cited by
-
Computer-aided detection of early interstitial lung diseases using low-dose CT images.Phys Med Biol. 2011 Feb 21;56(4):1139-53. doi: 10.1088/0031-9155/56/4/016. Epub 2011 Jan 25. Phys Med Biol. 2011. PMID: 21263171 Free PMC article.
-
Discovering mammography-based machine learning classifiers for breast cancer diagnosis.J Med Syst. 2012 Aug;36(4):2259-69. doi: 10.1007/s10916-011-9693-2. Epub 2011 Apr 9. J Med Syst. 2012. PMID: 21479624
-
Computer-aided detection; the effect of training databases on detection of subtle breast masses.Acad Radiol. 2010 Nov;17(11):1401-8. doi: 10.1016/j.acra.2010.06.009. Epub 2010 Jul 22. Acad Radiol. 2010. PMID: 20650667 Free PMC article.
-
Computerized prediction of risk for developing breast cancer based on bilateral mammographic breast tissue asymmetry.Med Eng Phys. 2011 Oct;33(8):934-42. doi: 10.1016/j.medengphy.2011.03.001. Epub 2011 Apr 8. Med Eng Phys. 2011. PMID: 21482168 Free PMC article.
-
Improving the performance of computer-aided detection of subtle breast masses using an adaptive cueing method.Phys Med Biol. 2012 Jan 21;57(2):561-75. doi: 10.1088/0031-9155/57/2/561. Phys Med Biol. 2012. PMID: 22218075 Free PMC article.
References
-
- Khoo LA, Taylor P, Given-Wilson RM. Computer-aided detection in the United Kingdom National Breast Screening Programme: prospective study. Radiology. 2005;237:444–449. - PubMed
-
- Ko JM, Nicholas MJ, Mendel JB, Slanetz PJ. Prospective assessment of computer-aided detection in interpretation of screening mammograms. Am J Roentgenol. 2006;187:1483–1491. - PubMed
-
- Nishikawa RM. Current status and future directions of computer-aided diagnosis in mammography. Comput Med Imaging Graph. 2007;31:224–235. - PubMed
-
- Rymon R, Zheng B, Chang YH, Gur D. Incorporation of a set enumeration trees-based classifier into a hybrid computer-assisted diagnosis scheme for mass detection. Acad Radiol. 1998;5:181–187. - PubMed
Publication types
MeSH terms
Grants and funding
LinkOut - more resources
Full Text Sources
Medical
Miscellaneous
