

Parenchymal texture analysis in digital breast tomosynthesis for breast cancer risk estimation: a preliminary study
- PMID: 19201357
- PMCID: PMC2666098
- DOI: 10.1016/j.acra.2008.08.014
Parenchymal texture analysis in digital breast tomosynthesis for breast cancer risk estimation: a preliminary study
Abstract
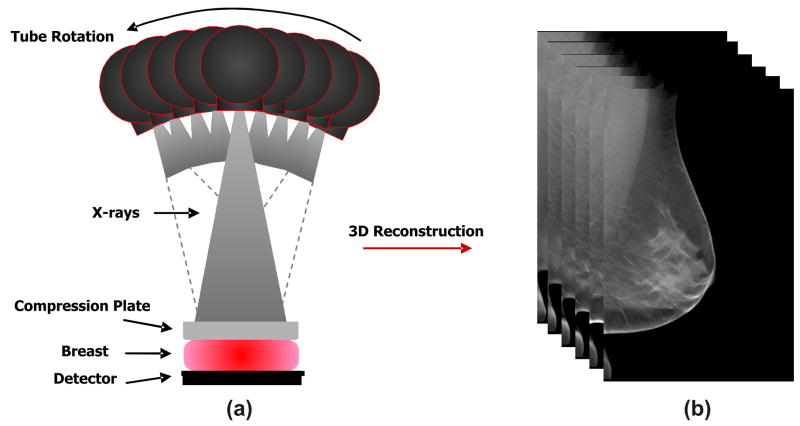
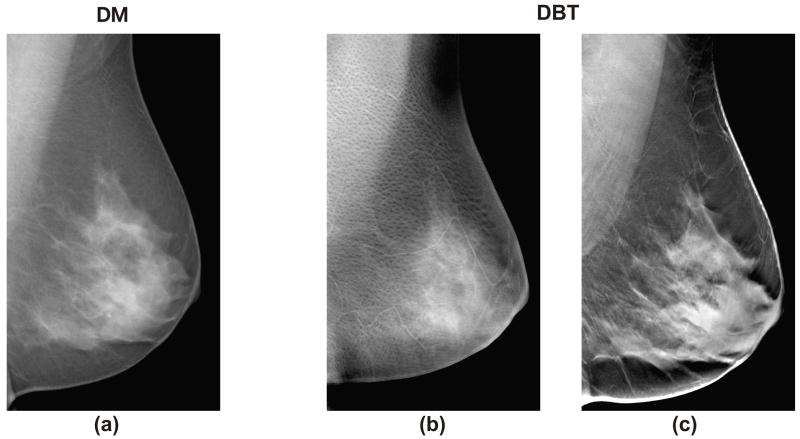
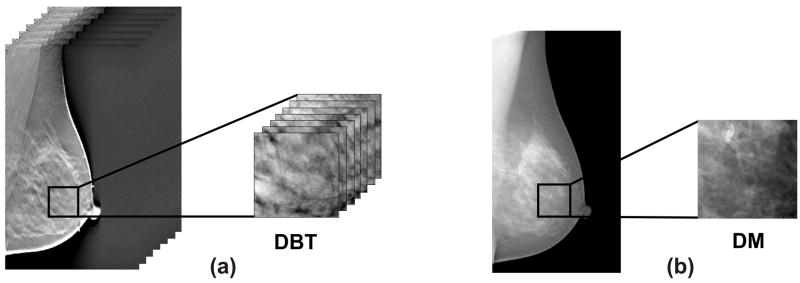
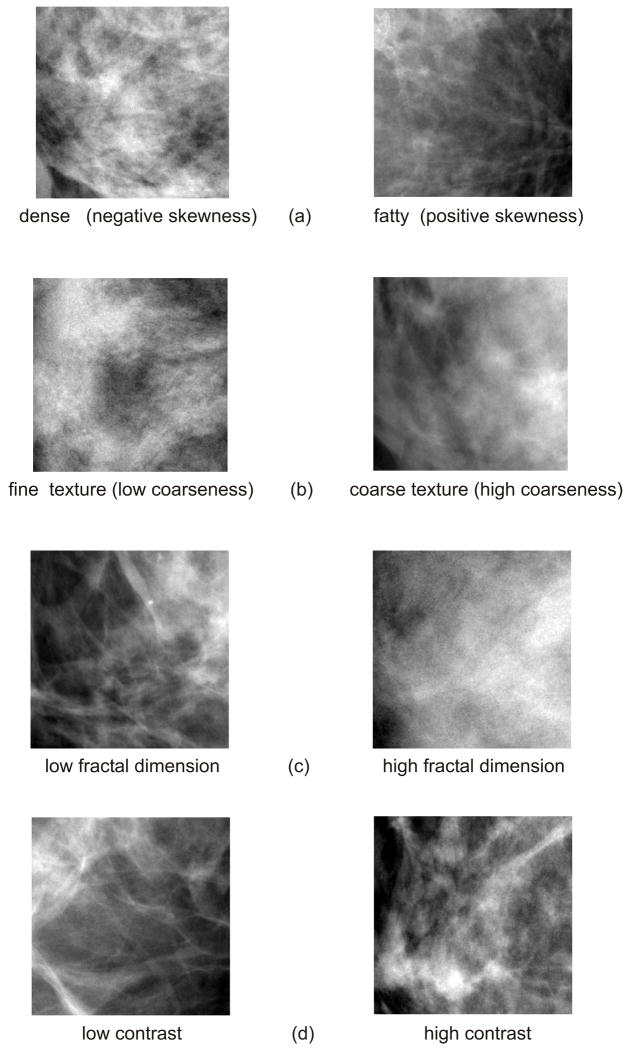
Rationale and objectives: Studies have demonstrated a relationship between mammographic parenchymal texture and breast cancer risk. Although promising, texture analysis in mammograms is limited by tissue superposition. Digital breast tomosynthesis (DBT) is a novel tomographic x-ray breast imaging modality that alleviates the effect of tissue superposition, offering superior parenchymal texture visualization compared to mammography. The aim of this study was to investigate the potential advantages of DBT parenchymal texture analysis for breast cancer risk estimation.
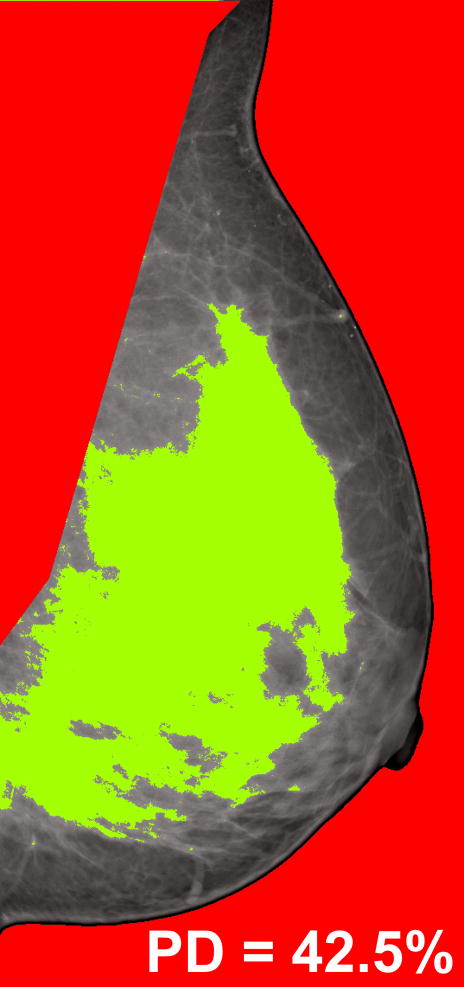
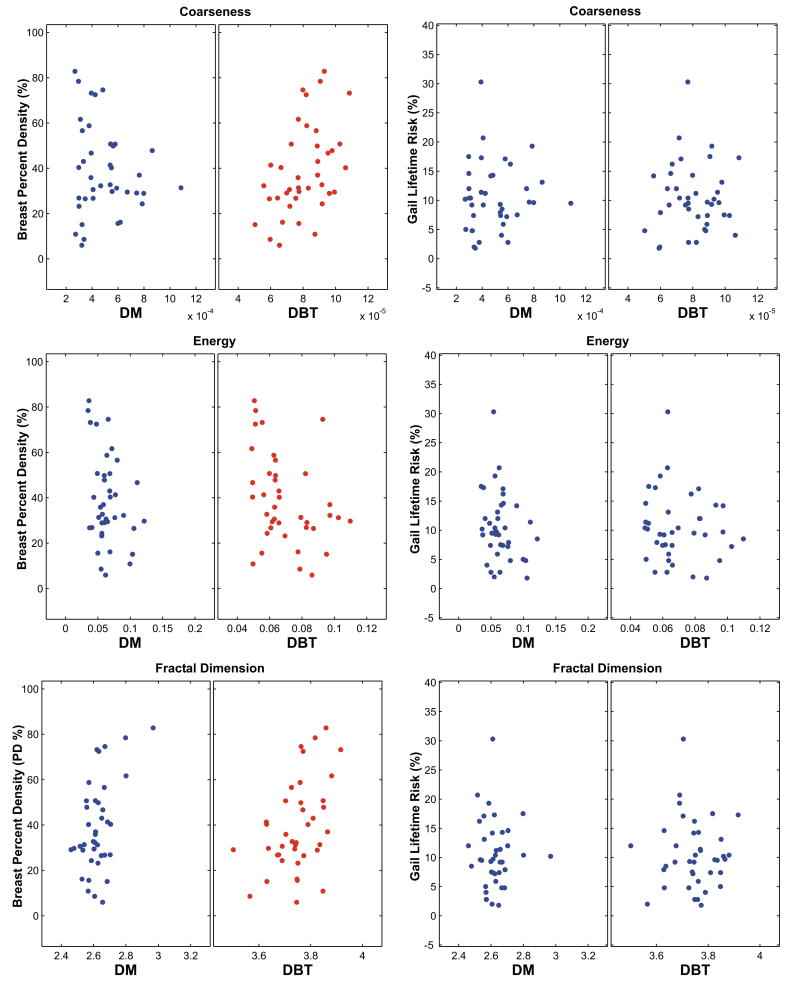
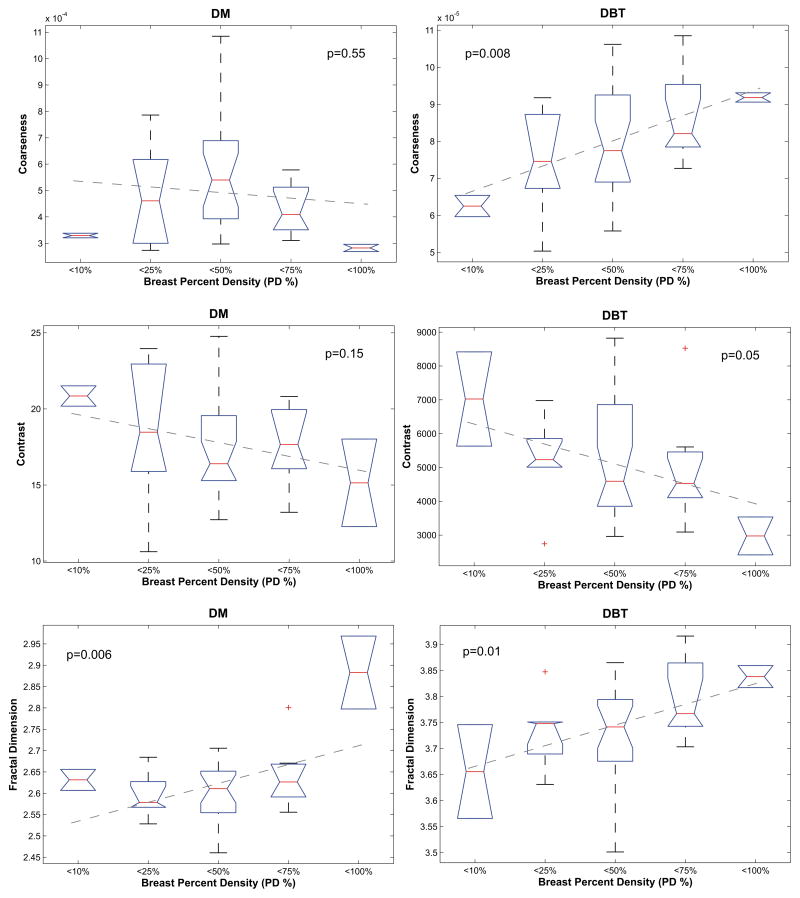
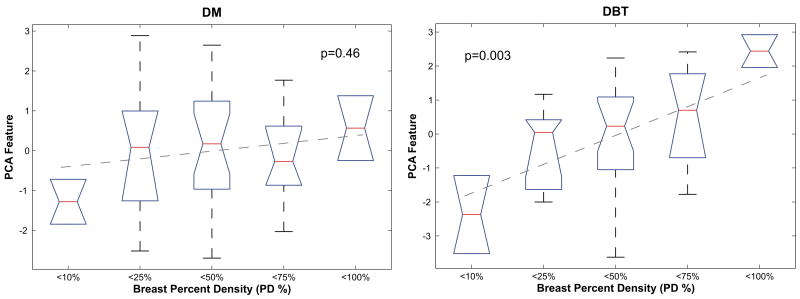
Materials and methods: DBT and digital mammographic (DM) images of 39 women were analyzed. Texture features, shown in previous studies with mammograms to correlate with cancer risk, were computed from the retroareolar breast region. The relative performances of the DBT and DM texture features were compared in correlating with two measures of breast cancer risk: (1) the Gail and Claus risk estimates and (2) mammographic breast density. Linear regression was performed to model the association between texture features and increasing levels of risk.
Results: No significant correlation was detected between parenchymal texture and the Gail and Claus risk estimates. Significant correlations were observed between texture features and breast density. Overall, the DBT texture features demonstrated stronger correlations with breast percent density than DM features (P < or = .05). When dividing the study population into groups of increasing breast percent density, the DBT texture features appeared to be more discriminative, having regression lines with overall lower P values, steeper slopes, and higher R(2) estimates.
Conclusion: Although preliminary, the results of this study suggest that DBT parenchymal texture analysis could provide more accurate characterization of breast density patterns, which could ultimately improve breast cancer risk estimation.
Figures
References
-
- Lehman CD, Blume JD, Weatherall P, et al. Screening women at high risk for breast cancer with mammography and magnetic resonance imaging. Cancer. 2005;103:1898–1905. - PubMed
-
- Lehman CD, Isaacs C, Schnall MD, et al. Cancer yield of mammography, MR, and US in high-risk women: prospective multi-institution breast cancer screening study. Radiology. 2007;224:381–388. - PubMed
-
- Smith KL, Isaacs C. Management of women at increased risk for hereditary breast cancer. Breast Disease. 2006–2007;27:51–67. - PubMed
-
- Gail MH, Brinton LA, Byar DP, et al. Projecting individualized probabilities of developing breast cancer for white females who are being examined annually. Journal of the National Cancer Institute. 1989;81:1879–1886. - PubMed
-
- Claus EB, Risch N, Thompson WD, Carter D. Relationship between breast histopathology and family history of breast cancer. Cancer. 1993;71:147–153. - PubMed
Publication types
MeSH terms
Grants and funding
LinkOut - more resources
Full Text Sources
Other Literature Sources
Medical
