. 2009 Jun;50(6):1068-79.
doi: 10.1194/jlr.M800491-JLR200. Epub 2009 Feb 5.

The role of LMNA in adipose: a novel mouse model of lipodystrophy based on the Dunnigan-type familial partial lipodystrophy mutation

Affiliations

The role of LMNA in adipose: a novel mouse model of lipodystrophy based on the Dunnigan-type familial partial lipodystrophy mutation

Kari M Wojtanik et al. J Lipid Res. 2009 Jun.

Abstract

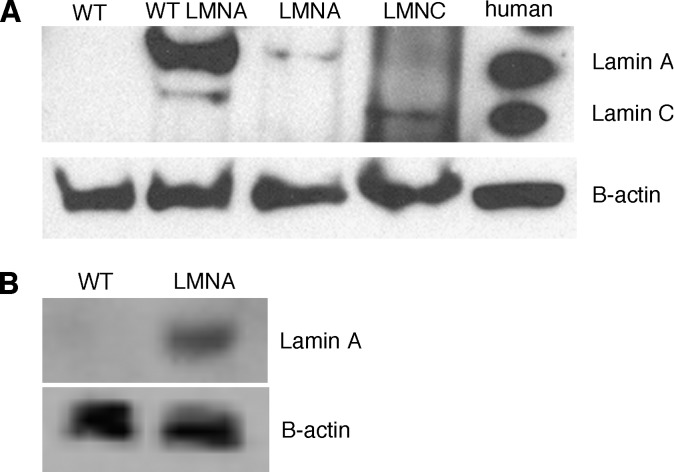
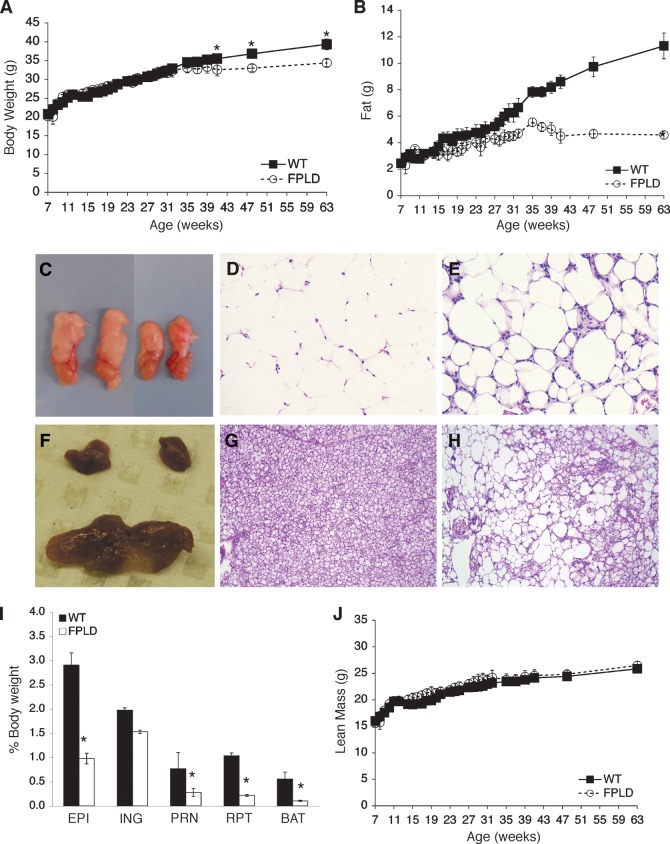
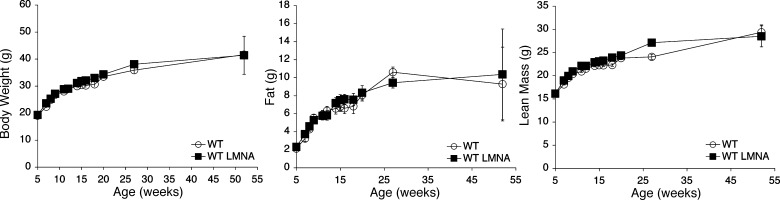
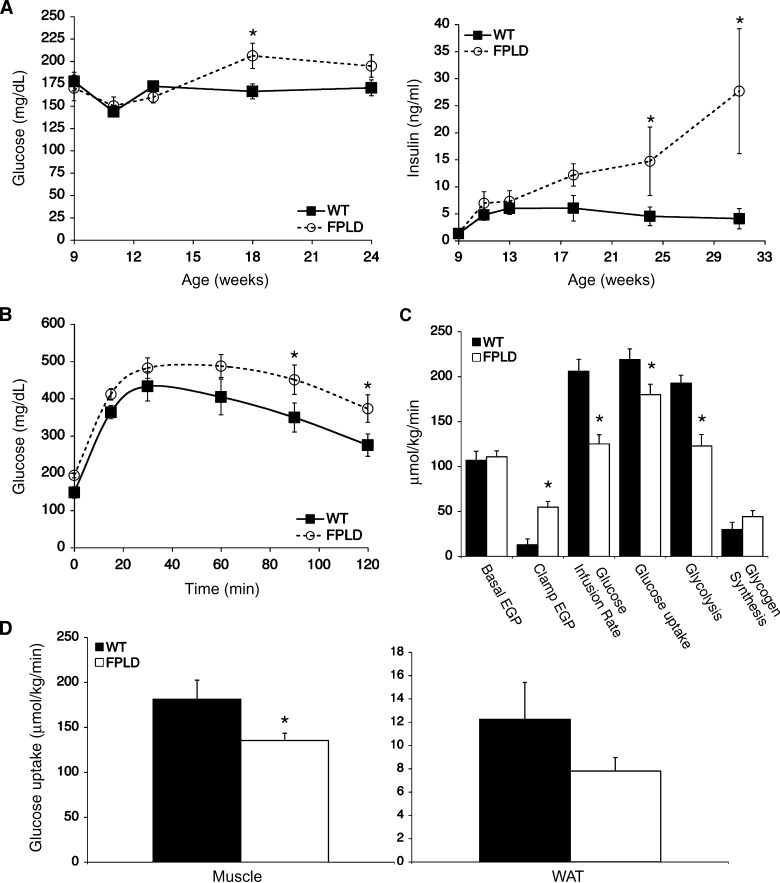
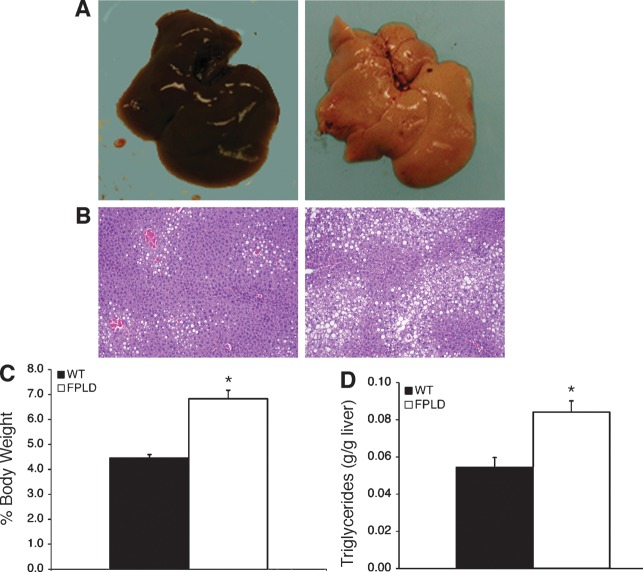
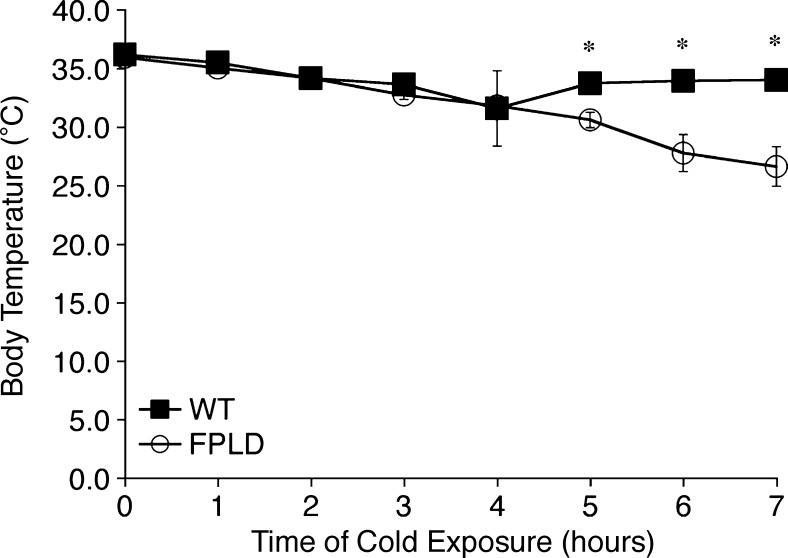
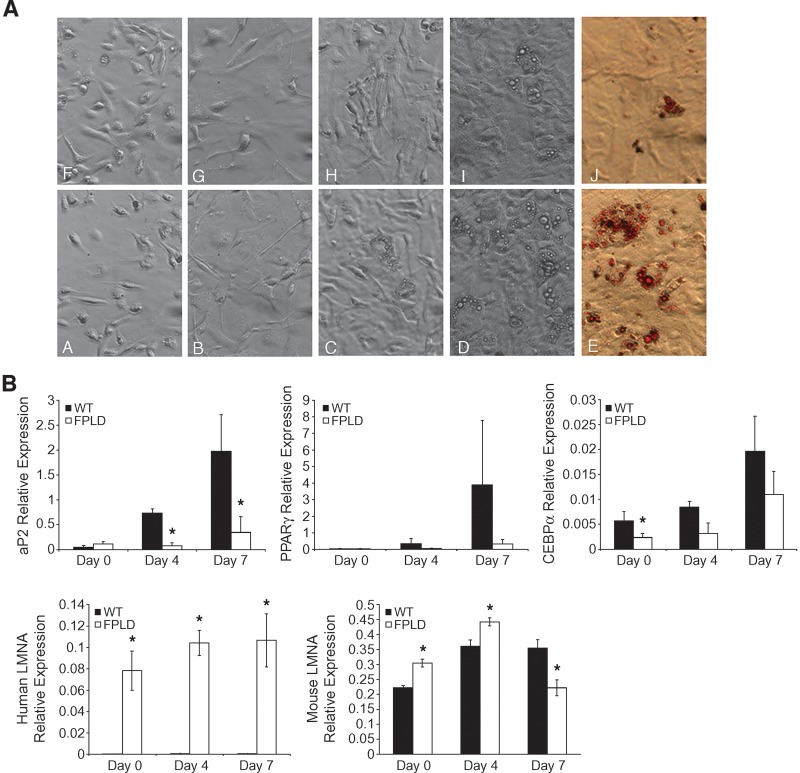
We investigated the role of LMNA in adipose tissue by developing a novel mouse model of lipodystrophy. Transgenic mice were generated that express the LMNA mutation that causes familial partial lipodystrophy of the Dunnigan type (FPLD2). The phenotype observed in FPLD-transgenic mice resembles many of the features of human FPLD2, including lack of fat accumulation, insulin resistance, and enlarged, fatty liver. Similar to the human disease, FPLD-transgenic mice appear to develop normally, but after several weeks they are unable to accumulate fat to the same extent as their wild-type littermates. One poorly understood aspect of lipodystrophies is the mechanism of fat loss. To this end, we have examined the effects of the FPLD2 mutation on fat cell function. Contrary to the current literature, which suggests FPLD2 results in a loss of fat, we found that the key mechanism contributing to the lack of fat accumulation involves not a loss, but an apparent inability of the adipose tissue to renew itself. Specifically, preadipocytes are unable to differentiate into mature and fully functional adipocytes. These findings provide insights not only for the treatment of lipodystrophies, but also for the study of adipogenesis, obesity, and insulin resistance.


Figures

Fig. 1.
Fig. 1.
Expression of lamin A and lamin C in mouse adipose tissue and macrophages. (A) Immunoblot analysis showing expression of lamin A and lamin C protein in adipose tissue isolated from wild-type animals, transgenic animals expressing wild-type human LMNA, transgenic animals expressing mutant human lamin A or lamin C, and human fibroblasts. (B) Immunoblot analysis showing expression of human lamin A in intraperitoneal macrophages isolated from wild-type and transgenic animals expressing mutant human lamin A.
Fig. 2.
Fig. 2.
Body weight, body composition, and adipose histology of FPLD transgenic mice and wild-type littermates on high-fat diet. (A) Body weights of control and FPLD mice. FPLD mice showed no significant differences in body weight until week 41 (week 41, *P = 0.02; week 48, *P = 0.002; week 63, *P < 0.0001). There was no significant difference between the two groups, as a whole, over time. (B) Total body fat of control and FPLD mice. FPLD mice begin to lose their ability to accumulate fat after 14 weeks of age. All data points were significant after 17 weeks and there was a significant difference between the two groups over time (*P < 0.0001). After 63 weeks, FPLD mice have approximately 59% less body fat than control littermates. (C) Gross anatomy of epididymal WAT from age and weight matched wild-type (left) and FPLD (right) mice. Hemotoxylin and eosin stained sections of epididymal WAT from wild-type (D) and FPLD (E) mice. (F) Gross anatomy of BAT from wild-type (bottom) and FPLD (top) mice. Hemotoxylin and eosin stained sections of BAT from wild-type (G) and FPLD (H) mice. (I) Weight of individual fat depots expressed as percentage of body weights. FPLD mice had significantly less fat in all depots examined compared with control littermates on both chow and high fat diet (*P = 0.02 – 0.0001), except inguinal fat (P = 0.18). EPI, epididymal; ING, inguinal; PRN, perirenal; RPT, retro-peritoneal. (J) Total body lean mass of control and FPLD mice. All data are expressed as averages ± SEM (n = 6/group).
Fig. 3.
Fig. 3.
Body weight and composition of transgenic mice on a high-fat diet, expressing wild-type human lamin A protein. Transgenic mice expressing the wild-type human lamin A display no significant differences in body weight, fat mass, or muscle mass compared with wild-type control littermates, which express no human isoform.
Fig. 4.
Fig. 4.
Glucose tolerance and insulin sensitivity. (A) Blood glucose (left) and serum insulin (right) were measured at the indicated time points from postprandial control and FPLD mice on high-fat diet (n = 5–7/group). FPLD mice do not show dramatic changes in blood glucose levels compared with controls, but have significantly higher serum insulin levels at 24 and 31 weeks (*P = 0.04 and *P < 0.0001, respectively). (B) Glucose tolerance test using 3 mg/g glucose in overnight-fasted control and FPLD mice on high-fat diet (n = 5–7/group). FPLD mice show significantly higher blood glucose levels at 90 and 120 min during a glucose tolerance test (*P = 0.03 and 0.04, respectively). (C) Whole-body glucose fluxes in 32 week old control and FPLD mice during euglycemic-hyperinsulinemic clamp studies (n = 4–5/group). Clamp EGP, P = 0.002; glucose uptake, P = 0.05; glycolysis, P = 0.004. EGP, endogenous glucose production. (D) Tissue glucose uptake rates during clamp studies. FPLD mice have a 25–30% decease in insulin sensitivity in muscle (*P = 0.03) and WAT. All data are expressed as averages ± SEM.
Fig. 5.
Fig. 5.
Liver histology, weight, and triglyceride content. (A) Gross pathology of livers from representative control (left) and FPLD (right) mice at 32 weeks of age on a high fat diet. (B) Hemotoxylin and eosin stained sections of livers from representative control (left) and FPLD (right) mice at 32 weeks of age on high-fat diet. (C) Liver weight expressed as percentage of total body weight from control and FPLD mice at 32 weeks of age on a high-fat diet (n = 6/group). FPLD livers weighed significantly more than livers from control animals (*P = 0.0004). (D) Triglyceride content of livers from control and FPLD mice at 32 weeks of age on high-fat diet (n = 4–6/group). Livers from FPLD mice had significantly more triglyceride per gram of liver than control mice (*P = 0.006). Data are expressed as averages ± SEM.
Fig. 6.
Fig. 6.
Thermogenesis in wild-type and FPLD mice at 32 weeks of age. Changes in core body temperature were measured during exposure to 4°C for 7 h. FPLD mice have significantly lower body temperatures at 5, 6, and 7 h compared with wild-type littermates (*P = 0.01, 0.01, and 0.008, respectively). Data are expressed as averages ± SEM, n = 4–6 per group.
Fig. 7.
Fig. 7.
Lipolysis of triglycerides in adipocytes isolated from epididymal fat pads from control and FPLD mice at 32 weeks of age on a high-fat diet. Lipolysis was measured under basal (unstimulated) and stimulated (isoproterenol) conditions and expressed as percent of basal activity (nmol of glycerol release per 106 cells). Data are expressed as averages ± SEM, n = 6/group. There is no significant difference between control and transgenic animals.
Fig. 8.
Fig. 8.
Adipocyte differentiation and gene expression in cells isolated from control (A–E) or FPLD (F–J) mice at 30 weeks of age on a high-fat diet. (A) Stromal vascular fractions isolated from epididymal fat fads were cultured and induced to differentiate over a period of 7-8 days. Panels A and F, one day after culture; B and G, day 0 of differentiation; C and H, day 4 of differentiation; D and I, day 7 of differentiation; E and J, Oil red O staining at day 7 of differentiation. By day 7 of differentiation, cells isolated from FPLD mice show clear defects in their ability to differentiate into mature adipocytes and accumulate lipid. Figures shown are representative of 4 independent experiments, where n = 3/group/experiment. (B) Real-time PCR of adipocyte differentiation marker genes. Real-time PCR quantitation was performed using RNA harvested on day 0, 4, and 7 of differentiation. Amplification of each sample was performed in triplicate or quadruplicate and normalized to GAPDH. aP2, *P = 0.002 and 0.004, respectively; CEBPα, *P = 0.04; human LMNA, *P = 0.0009, 0.001, and 0.0003, respectively; mouse LMNA, *P = 0.001, 0.02, 2.65 × 10⁻⁶, respectively. Data are expressed as relative expression compared with control gene, GAPDH, ± SEM, n = 3–6/group.

References

    1. Agarwal A. K., and A. Garg. 2006. Genetic basis of lipodystrophies and management of metabolic complications. Annu. Rev. Med. 57 297–311. - PubMed
    1. Rajala M. W., and P. E. Scherer. 2003. Minireview: The adipocyte–at the crossroads of energy homeostasis, inflammation, and atherosclerosis. Endocrinology. 144 3765–3773. - PubMed
    1. Cao H., and R. A. Hegele. 2000. Nuclear lamin A/C R482Q mutation in canadian kindreds with Dunnigan-type familial partial lipodystrophy. Hum. Mol. Genet. 9 109–112. - PubMed
    1. Jacob K. N., and A. Garg. 2006. Laminopathies: multisystem dystrophy syndromes. Mol. Genet. Metab. 87 289–302. - PubMed
    1. Garg A., R. M. Peshock, and J. L. Fleckenstein. 1999. Adipose tissue distribution pattern in patients with familial partial lipodystrophy (Dunnigan variety). J. Clin. Endocrinol. Metab. 84 170–174. - PubMed

Publication types

MeSH terms