. 2009 Feb 15;182(4):1868-76.
doi: 10.4049/jimmunol.0802501.

Requirement of B cells for generating CD4+ T cell memory

Affiliations

Requirement of B cells for generating CD4+ T cell memory

Jason K Whitmire et al. J Immunol. .

Abstract

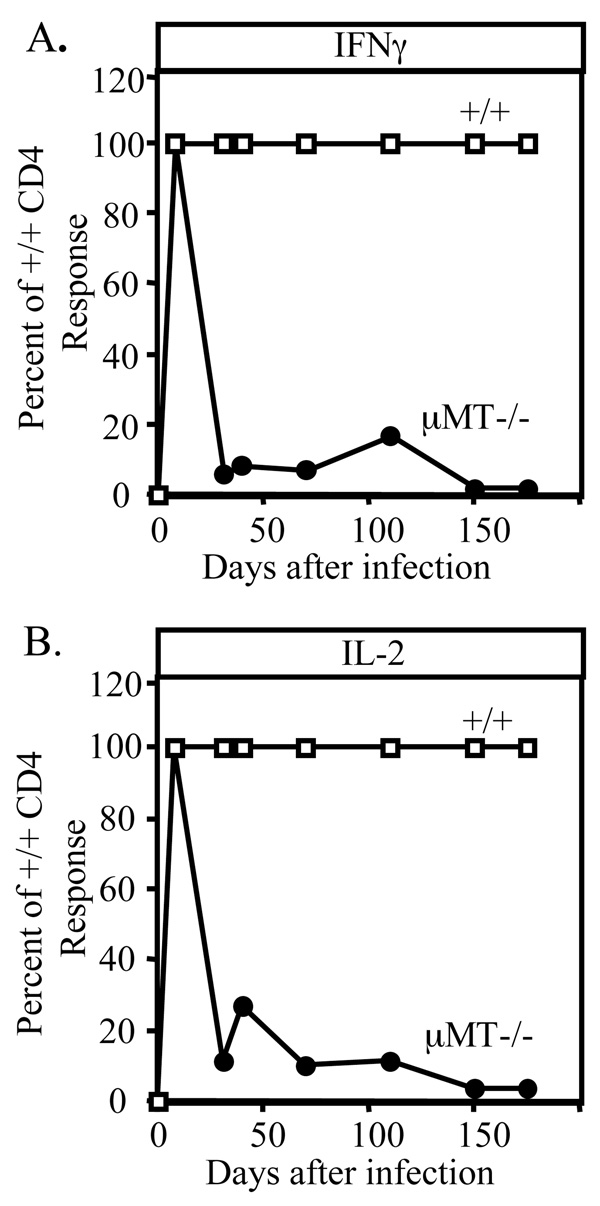
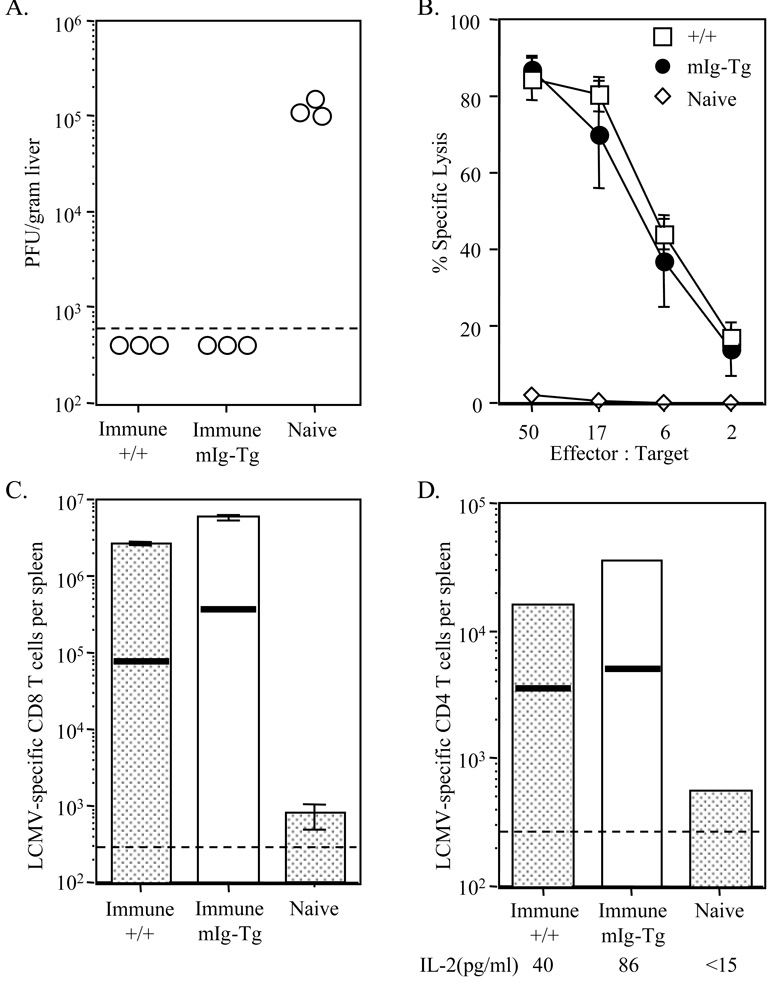
B cells can influence T cell responses by directly presenting Ag or by secreting Ab that binds to Ag to form immunogenic complexes. Conflicting evidence suggests that persisting Ag-Ab complexes propagate long-term T cell memory; yet, other data indicate that memory cells can survive without specific Ag or MHC. In this study, the roles of B cells and Ag-Ab complexes in T cell responses to lymphocytic choriomeningitis virus (LCMV) infection were investigated using B cell-deficient or B cell-competent mice. Despite normal lymphocyte expansion after acute infection, B cell-deficient mice rapidly lost CD4(+) T cell memory, but not CD8(+) T cell memory, during the contraction phase. To determine whether Ag-Ab complexes sustain CD4(+) T cell memory, T cell responses were followed in B cell-transgenic (mIg-Tg) mice that have B cells but neither LCMV-specific Ab nor LCMV-immune complex deposition. In contrast to B cell-deficient mice, mIg-Tg mice retained functional Th cell memory, indicating that B cells selectively preserve CD4(+) T cell memory independently of immune complex formation. An in vivo consequence of losing CD4(+) T cell memory was that B cell-deficient mice were unable to resolve chronic virus infection. These data implicate a B cell function other than Ab production that induces long-term protective immunity.


Figures

Figure 1
Figure 1. Preferential loss of CD4 memory in B cell-deficient mice
B cell-deficient (µMT−/−) and +/+ mice were infected with 2 × 10⁵ PFU of LCMV (strain Armstrong), and LCMV-specific CD8 and CD4 T cell responses were quantified in the same mice by intracellular IFN-γ staining. Primary responses were measured at day 8 after infection, and memory responses were measured at days 70–154. (A) An example of the CD8 response to LCMV peptide GP33-41 with numbers indicating the frequency of CD8+ T cells that are GP33-specific. (B) The number of GP33-specific CD8+ T cells per spleen at various times after infection. (C) The CD4 response at days 8 and 154 with numbers indicating the frequency of CD4 T cells specific to GP61-80. (D) The number of GP61-80 specific CD4 T cells per spleen at day 8 or memory time points. In panels B and D, the numbers in parenthesis indicate the fold reduction in cell number between primary and memory time points. The dashed lines depict the limits of detection by this assay, and error bars represent standard deviations of 3 mice from a representative experiment.
Figure 2
Figure 2. Kinetics of CD4 memory loss in the absence of B cells
CD4 responses were quantified at various times after infection in +/+ and B cell-deficient mice. CD4 T cells were column purified, cultured for 24 hours with virus re-stimulation, and then cytokine levels in the supernatants were measured by ELISA. The relative amount of IFN-γ (A) or IL-2 (B) made by B cell-deficient CD4 T cells is shown as a percentage of what was made by +/+ CD4 cultures.
Figure 3
Figure 3. mIg-Tg mice have B cells but no LCMV-specific serum antibody
Spleen cells from control and mIg-Tg mice were stained for B cells 8 days after infection (A). The level of LCMV-specific IgG in the serum was determined by ELISA at days 8 or 18 after infection (B).
Figure 4
Figure 4. Primary and memory T cell responses in mIg-Tg mice
mIg-Tg and +/+ mice were infected with 2 × 10⁵ PFU of Armstrong, and T cell responses were analyzed at various times after infection. (A) Numbers of LCMV-specific CD8+ T cells were quantified by IFN-γ ELISPOT assay following stimulation with LCMV peptide NP118-126. The averages of 2–3 mice per time point are shown. (B) CTLprecursors were quantified by limiting dilution assay at day 8 (primary) or days 34, 60, and 68 (memory). The bars represent the average of 4–7 mice per group. (C) CD4+ T cells were column purified and then stimulated with LCMV-carrier spleen cells in an IFN-γ ELISOT assay. The line graphs show the total number of CD4+ T cells per spleen that produced IFN-γ in this assay. The averages of 2–3 mice per time point are shown. (D) Purified CD4+ T cells were cultured with virus-infected carrier spleen cells for 24 hours. ELISA was used to measure the levels of IL-2 in the supernatants. The bars represent the average of 4–7 mice per group. Dashed lines indicate the limits of detection for each assay and the error bars represent standard deviations.
Figure 5
Figure 5. Anamnestic responses in immune mIg-Tg mice
Wildtype and mIg-Tg mice immunized 90 days earlier with LCMV were re-challenged with 106 PFU of LCMV (strain-Armstrong) and at day 3 after the re-infection, levels of virus and T cell responses were quantified. (A) The level of virus infection in the liver was determined by plaque assay. The amount of infection in the liver of naive mice is shown for comparison. (B) Levels of CTL in each group were measured by direct ex vivo 51Cr-release assay. Average specific lysis for immune mIg-Tg, +/+, and naive mice are shown with standard deviation error bars. (C) The number of LCMV-specific CD8+ T cells was determined by IFN-γ ELISPOT following NP118-126 stimulation. Horizontal lines represent the number of memory cells found in immune mice before re-infection, and the bars show the number found after re-infection. Bars represent the average of 2–3 mice. (D) CD4+ T cells from 2–3 mice were purified and the number of LCMV-specific CD4+ T cells was determined by IFN-γ ELISPOT following stimulation with LCMV-infected carrier spleen cells. The horizontal lines represent the number of memory CD4+ T cells found in immune mice before re-infection. Purified CD4+ T cells from each group were also analyzed by ELISA for IL-2 secretion following virus stimulation in vitro. The limit of detection for this assay was 15pg/ml. Dashed lines depict limits of detection for each assay.
Figure 6
Figure 6. B cell-deficient mice are unable to limit disseminated LCMV infection
The ability of mice to control chronic LCMV infection was followed as a stringent measure of their immune competence. (A) B cell-deficient (•) and +/+ (■) mice were infected with 3 different strains of LCMV that cause persistent infections. Mice were retro-orbitally bled at various times after infection and serum levels of virus were determined by plaque assay. (B-F) A separate set of B cell-deficient and +/+ mice were given LCMV-t1b, and 44 days later, the antiviral T cell responses in their spleens and viral load were measured. (B) An example of the CD8 response in mice as measured by intracellular IFNγ staining. The oval identifies the GP33-specific cells among all spleen cells and the numbers represent their frequency among all CD8 T cells. (C) The number of epitope-specific CD8+ T cells in wildtype (shaded bars) and B cell-deficient (open bars) was determined by intracellular IFNγ staining (top) and by tetramer staining (bottom). (D) The GP61-80-specific CD4+ T cell response was determined in these same mice by intracellular IFNγ staining. The dot plot is gated on all spleen cells and the oval identifies the IFNγ+ve CD4+ T cells. The number indicates the percentage of IFNγ +ve CD4+ T cells among all CD4+ T cells. (E) The total number of GP61-80-specific CD4+ T cells per spleen in these mice (top). Purified CD4+ T cells from two B cell-deficient and +/+ mice that were given chronic virus infection were restimulated in vitro with virus-infected carrier spleen cells; the bars indicate the amount of IL-2 produced by these cells as measured by ELISA (bottom). (F) The bar graphs show the level of virus found in the LCMV-t1b-infected mice at day 44 as determined by plaque assay. (G-H) Spleen cells (2–3 × 10⁷) from LCMV immune +/+ or B cell-deficient mice were adoptively transferred to congenitally infected LCMV-carrier mice. (G) The recipients were retro-orbitally bled at various times after transfer, and serum levels of virus were measured by plaque assay. The average and standard deviation of 4 mice per group are shown. (H) Spleen cells from the carrier mice were analyzed at day 160 post-transfer for LCMV-specific CTLprecursors by limiting dilution assay. While CTLp were detectable in mice that received immune +/+ cells, the number of CTLp in mice that received immune B cell-deficient cells was below detection. The dashed lines indicate the limits of detection of the assays.

References

    1. Seder RA, Ahmed R. Similarities and differences in CD4+ and CD8+ effector and memory T cell generation. Nat Immunol. 2003;4:835–842. - PubMed
    1. Rogers PR, Dubey C, Swain SL. Qualitative changes accompany memory T cell generation: faster, more effective responses at lower doses of antigen. J Immunol. 2000;164:2338–2346. - PubMed
    1. Kondrack RM, Harbertson J, Tan JT, McBreen ME, Surh CD, Bradley LM. Interleukin 7 regulates the survival and generation of memory CD4 cells. J Exp Med. 2003;198:1797–1806. - PMC - PubMed
    1. Li J, Huston G, Swain SL. IL-7 promotes the transition of CD4 effectors to persistent memory cells. J Exp Med. 2003;198:1807–1815. - PMC - PubMed
    1. Kaech SM, Tan JT, Wherry EJ, Konieczny BT, Surh CD, Ahmed R. Selective expression of the interleukin 7 receptor identifies effector CD8 T cells that give rise to long-lived memory cells. Nat Immunol. 2003;4:1191–1198. - PubMed

Publication types

MeSH terms