

The control of autumn senescence in European aspen
- PMID: 19201914
- PMCID: PMC2663763
- DOI: 10.1104/pp.108.133249
The control of autumn senescence in European aspen
Abstract
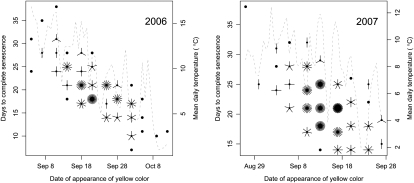
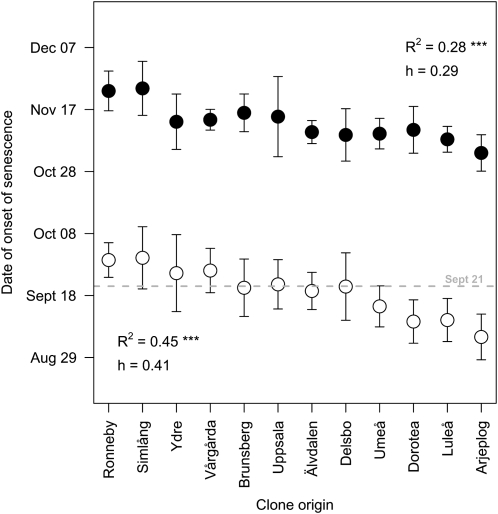
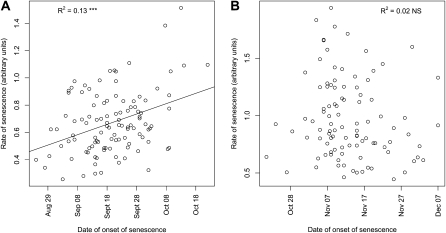
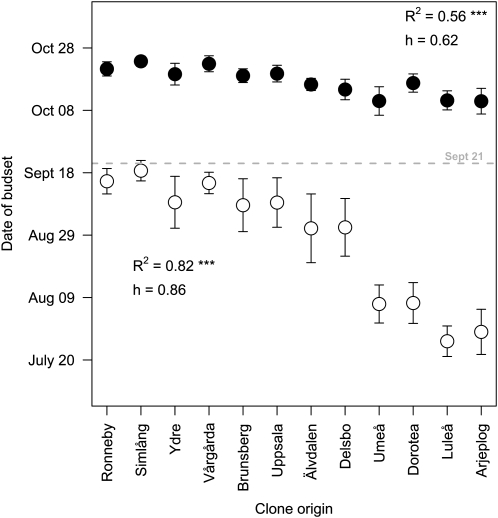
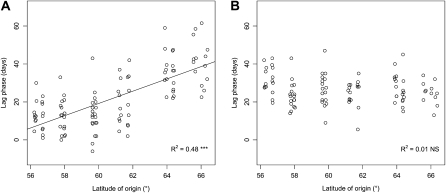
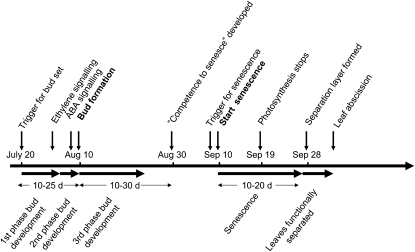
The initiation, progression, and natural variation of autumn senescence in European aspen (Populus tremula) was investigated by monitoring chlorophyll degradation in (1) trees growing in natural stands and (2) cloned trees growing in a greenhouse under various light regimes. The main trigger for the initiation of autumn senescence in aspen is the shortening photoperiod, but there was a large degree of variation in the onset of senescence, both within local populations and among trees originating from different populations, where it correlated with the latitude of their respective origins. The variation for onset of senescence with a population was much larger than the variation of bud set. Once started, autumn senescence was accelerated by low temperature and longer nights, and clones that started to senescence late had a faster senescence. Bud set and autumn senescence appeared to be under the control of two independent critical photoperiods, but senescence could not be initiated until a certain time after bud set, suggesting that bud set and growth arrest are important for the trees to acquire competence to respond to the photoperiodic trigger to undergo autumn senescence. A timetable of events related to bud set and autumn senescence is presented.
Figures
Similar articles
-
Autumn senescence in aspen is not triggered by day length.Physiol Plant. 2018 Jan;162(1):123-134. doi: 10.1111/ppl.12593. Epub 2017 Jul 11. Physiol Plant. 2018. PMID: 28591431
-
Temperature signals contribute to the timing of photoperiodic growth cessation and bud set in poplar.Tree Physiol. 2011 May;31(5):472-82. doi: 10.1093/treephys/tpr038. Tree Physiol. 2011. PMID: 21636689
-
Timing of photoperiodic competency causes phenological mismatch in balsam poplar (Populus balsamifera L.).Plant Cell Environ. 2013 Jan;36(1):116-27. doi: 10.1111/j.1365-3040.2012.02560.x. Epub 2012 Jul 12. Plant Cell Environ. 2013. PMID: 22702736
-
Photoperiod- and temperature-mediated control of growth cessation and dormancy in trees: a molecular perspective.Ann Bot. 2017 Sep 1;120(3):351-360. doi: 10.1093/aob/mcx061. Ann Bot. 2017. PMID: 28605491 Free PMC article. Review.
-
Photoperiodic growth control in perennial trees.Plant Signal Behav. 2015;10(12):e1087631. doi: 10.1080/15592324.2015.1087631. Plant Signal Behav. 2015. PMID: 26340077 Free PMC article. Review.
Cited by
-
CO2 Elevation and Photoperiods North of Seed Origin Change Autumn and Spring Phenology as Well as Cold Hardiness in Boreal White Birch.Front Plant Sci. 2020 Apr 28;11:506. doi: 10.3389/fpls.2020.00506. eCollection 2020. Front Plant Sci. 2020. PMID: 32411171 Free PMC article.
-
Stable water isotopes reveal the onset of bud dormancy in temperate trees, whereas water content is a better proxy for dormancy release.Tree Physiol. 2024 Apr 3;44(4):tpae028. doi: 10.1093/treephys/tpae028. Tree Physiol. 2024. PMID: 38417929 Free PMC article.
-
Leaf mineral nutrient remobilization during leaf senescence and modulation by nutrient deficiency.Front Plant Sci. 2015 May 13;6:317. doi: 10.3389/fpls.2015.00317. eCollection 2015. Front Plant Sci. 2015. PMID: 26029223 Free PMC article.
-
Hormonal regulation of leaf senescence through integration of developmental and stress signals.Plant Mol Biol. 2013 Aug;82(6):547-61. doi: 10.1007/s11103-013-0043-2. Epub 2013 Mar 16. Plant Mol Biol. 2013. PMID: 23504405 Review.
-
Salicylic acid metabolism and signalling coordinate senescence initiation in aspen in nature.Nat Commun. 2023 Jul 18;14(1):4288. doi: 10.1038/s41467-023-39564-5. Nat Commun. 2023. PMID: 37463905 Free PMC article.
References
-
- Black BL, Parmentier Line C, Fuchigami LH, Coleman GD (2001) Ecotypic and genetic variation in poplar bark storage protein gene expression and accumulation. Tree Physiol 21 1289–1297 - PubMed
-
- Bopp M (1996) The origin of developmental physiology of plants in Germany. Int J Dev Biol 40 89–92 - PubMed
-
- Buchanan-Wollaston V, Earl S, Harrison E, Mathas E, Navabpour S, Page T, Pink D (2003) The molecular analysis of leaf senescence: a genomics approach. Plant Biotechnol J 1 3–22 - PubMed
Publication types
MeSH terms
Substances
LinkOut - more resources
Full Text Sources
