

Expiratory pharyngeal narrowing during central hypocapnic hypopnea
- PMID: 19201929
- PMCID: PMC2643080
- DOI: 10.1164/rccm.200805-741OC
Expiratory pharyngeal narrowing during central hypocapnic hypopnea
Abstract
Rationale: Ventilatory motor output is an important determinant of upper airway patency during sleep.
Objectives: We hypothesized that central hypocapnic hypopnea would lead to increased expiratory upper airway resistance and pharyngeal narrowing during non-REM sleep.
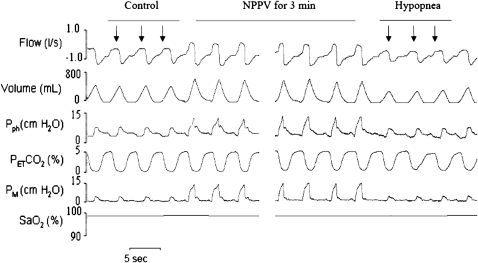
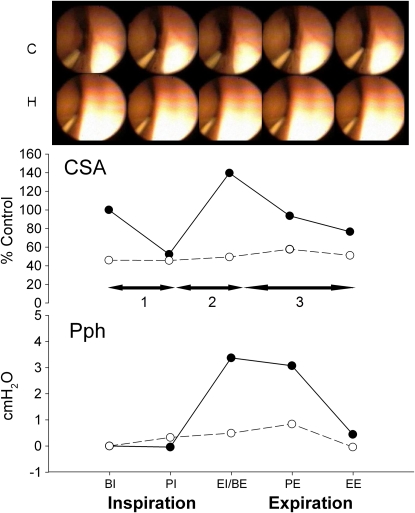
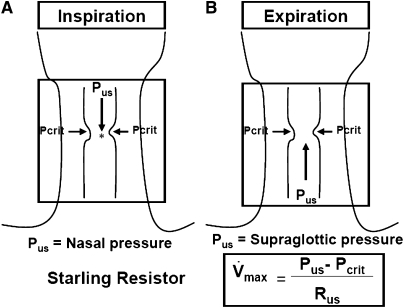
Methods: Noninvasive positive pressure ventilation was used to induce hypocapnic hypopnea in 20 healthy subjects. Expiratory pressure was set at the lowest pressure (2 cm H(2)O), and inspiratory pressure was increased gradually during each 3-minute noninvasive positive pressure ventilation trial by increments of 2 cm H(2)O. Analysis 1 (n = 9) included measured retropalatal cross-sectional area (CSA) using nasopharyngoscope to compare CSA at five points of the respiratory cycle between control (eupneic) and hypopneic breaths. The pharyngeal pressure (P(ph)) was measured using a catheter positioned at the palatal rim. Analysis 2 (n = 11) included measured supraglottic pressure and airflow to compare inspiratory and expiratory upper airway resistance (R(UA)) at peak flow between eupneic and hypopneic breaths.
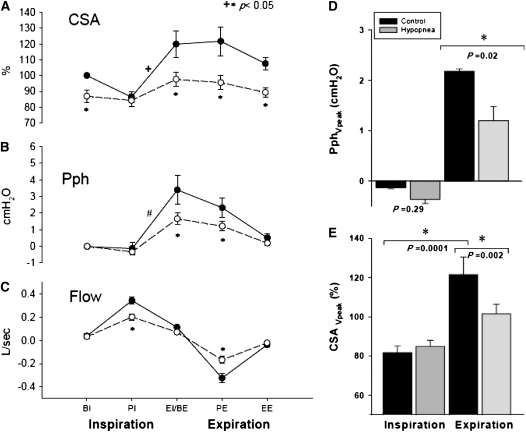
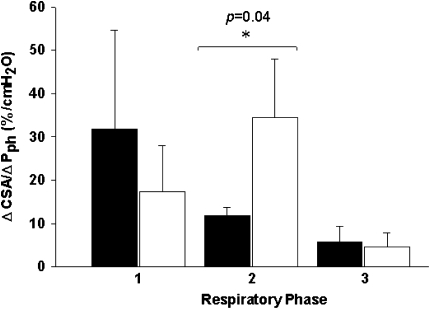
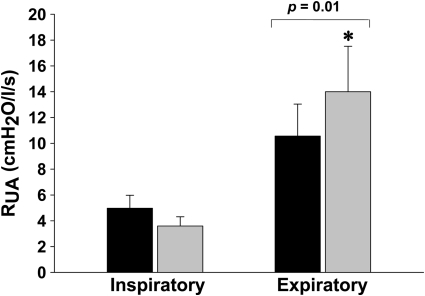
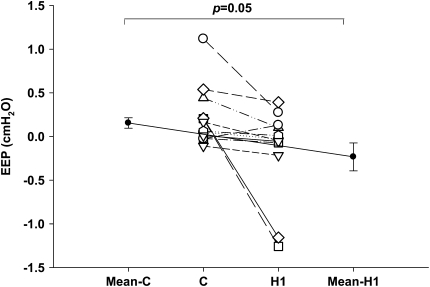
Measurements and main results: Expiratory CSA during hypopneic breaths was decreased relative to eupnea (CSA at beginning of expiration [BI]: 101.5 +/- 6.3 vs. 121.6 +/- 8.9%; P < 0.05); P(ph)-BI was lower than that generated during eupnea (1.5 +/- 0.3 vs. 3.3 +/- 0.9 cm H(2)O; P < 0.05). Body mass index was an independent predictor of retropalatal narrowing during hypopnea. Hypopnea-R(UA) increased during expiration relative to eupnea (14.0 +/- 5.7 vs. 10.6 +/- 2.5 cm H(2)O/L/s; P = 0.01), with no change in inspiratory resistance.
Conclusions: Expiratory pharyngeal narrowing occurs during central hypocapnic hypopnea. Reduced ventilatory drive leads to increased expiratory, but not inspiratory, upper airway resistance. Central hypopneas are obstructive events because they cause pharyngeal narrowing.
Figures
Similar articles
-
Effect of induced hypocapnic hypopnea on upper airway patency in humans during NREM sleep.Respir Physiol. 1997 Oct;110(1):33-45. doi: 10.1016/s0034-5687(97)00072-8. Respir Physiol. 1997. PMID: 9361150 Clinical Trial.
-
Hypocapnia is associated with increased upper airway expiratory resistance during sleep.Respir Physiol Neurobiol. 2011 Jul 31;177(2):108-13. doi: 10.1016/j.resp.2011.04.004. Epub 2011 Apr 13. Respir Physiol Neurobiol. 2011. PMID: 21513820 Free PMC article.
-
Pharyngeal narrowing/occlusion during central sleep apnea.J Appl Physiol (1985). 1995 May;78(5):1806-15. doi: 10.1152/jappl.1995.78.5.1806. J Appl Physiol (1985). 1995. PMID: 7649916 Clinical Trial.
-
Effect of ventilatory drive on upper airway patency in humans during NREM sleep.Respir Physiol. 1996 Jan;103(1):1-10. doi: 10.1016/0034-5687(95)00079-8. Respir Physiol. 1996. PMID: 8822218 Review.
-
[The dynamics of pharyngeal structures in obstructive sleep apnea (during spontaneous, continuous positive pressure and BiPAP ventilation)].Neurophysiol Clin. 1994 Jun;24(3):227-48. doi: 10.1016/s0987-7053(05)80187-x. Neurophysiol Clin. 1994. PMID: 8090156 Review. French.
Cited by
-
Research Priorities for Patients with Heart Failure and Central Sleep Apnea. An Official American Thoracic Society Research Statement.Am J Respir Crit Care Med. 2021 Mar 15;203(6):e11-e24. doi: 10.1164/rccm.202101-0190ST. Am J Respir Crit Care Med. 2021. PMID: 33719931 Free PMC article.
-
Potential protective mechanism of arousal in obstructive sleep apnea.J Thorac Dis. 2016 Jul;8(Suppl 7):S545-6. doi: 10.21037/jtd.2016.07.43. J Thorac Dis. 2016. PMID: 27606089 Free PMC article. No abstract available.
-
Postoperative apnea, respiratory strategies, and pathogenesis mechanisms: a review.J Anesth. 2013 Jun;27(3):423-32. doi: 10.1007/s00540-012-1517-0. Epub 2012 Nov 21. J Anesth. 2013. PMID: 23179739 Review.
-
Functional connectivity in raphé-pontomedullary circuits supports active suppression of breathing during hypocapnic apnea.J Neurophysiol. 2015 Oct;114(4):2162-86. doi: 10.1152/jn.00608.2015. Epub 2015 Jul 22. J Neurophysiol. 2015. PMID: 26203111 Free PMC article.
-
Algorithm for automatic detection of self-similarity and prediction of residual central respiratory events during continuous positive airway pressure.Sleep. 2021 Apr 9;44(4):zsaa215. doi: 10.1093/sleep/zsaa215. Sleep. 2021. PMID: 33057718 Free PMC article.
References
-
- Isono S, Remmers JE, Tanaka A, Sho Y, Sato J, Nishino T. Anatomy of pharynx in patients with obstructive sleep apnea and in normal subjects. J Appl Physiol 1997;82:1319–1326. - PubMed
-
- Bradley TD, Brown IG, Grossman RF, Zamel N, Martinez D, Phillipson EA, Hoffstein V. Pharyngeal size in snorers, nonsnorers, and patients with obstructive sleep apnea. N Engl J Med 1986;315:1327–1331. - PubMed
-
- Schwab RJ, Gupta KB, Gefter WB, Metzger LJ, Hoffman EA, Pack AI. Upper airway and soft tissue anatomy in normal subjects and patients with sleep-disordered breathing. Am J Respir Crit Care Med 1995;152:1673–1689. - PubMed
-
- Rowley JA, Sanders CS, Zahn BK, Badr MS. Gender differences in upper airway compliance during NREM sleep: role of neck circumference. J Appl Physiol 2002;92:2535–2541. - PubMed
-
- Henke KG, Arias A, Skatrud JB, Dempsey JA. Inhibition of inspiratory muscle activity during sleep: chemical and non-chemical influences. Am Rev Respir Dis 1988;138:8–15. - PubMed
Publication types
MeSH terms
LinkOut - more resources
Full Text Sources
Medical
Molecular Biology Databases
