

Alzheimer disease: quantitative structural neuroimaging for detection and prediction of clinical and structural changes in mild cognitive impairment
- PMID: 19201945
- PMCID: PMC2663582
- DOI: 10.1148/radiol.2511080924
Alzheimer disease: quantitative structural neuroimaging for detection and prediction of clinical and structural changes in mild cognitive impairment
Abstract
Purpose: To use structural magnetic resonance (MR) images to identify a pattern of regional atrophy characteristic of mild Alzheimer disease (AD) and to investigate whether presence of this pattern prospectively can aid prediction of 1-year clinical decline and increased structural loss in mild cognitive impairment (MCI).
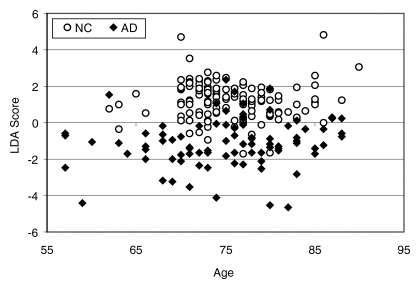
Materials and methods: The study was conducted with institutional review board approval and compliance with HIPAA regulations. Written informed consent was obtained from each participant. High-throughput volumetric segmentation and cortical surface reconstruction methods were applied to MR images from 84 subjects with mild AD, 175 with MCI, and 139 healthy control (HC) subjects. Stepwise linear discriminant analysis was used to identify regions that best can aid discrimination of HC subjects from subjects with AD. A classifier trained on data from HC subjects and those with AD was applied to data from subjects with MCI to determine whether presence of phenotypic AD atrophy at baseline was predictive of clinical decline and structural loss.
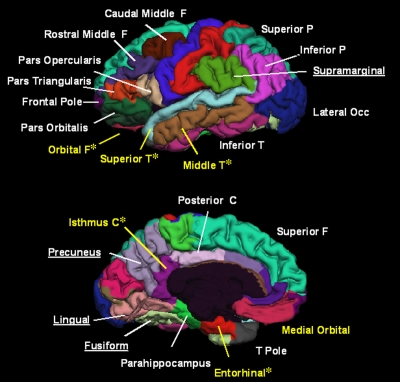
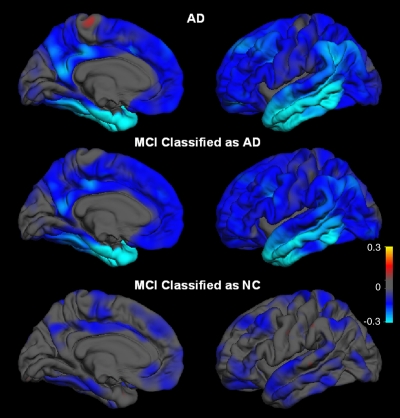
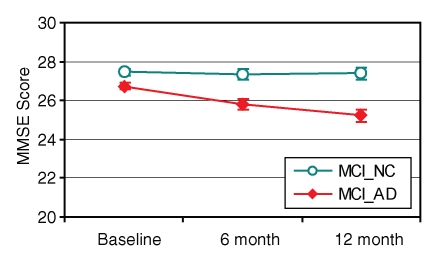
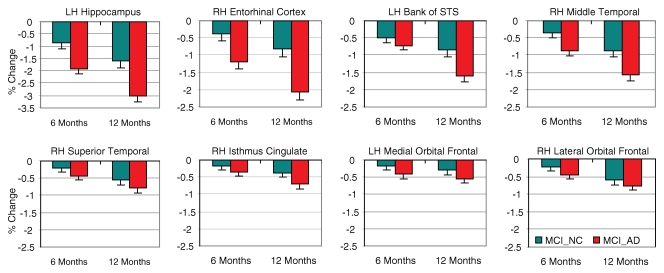
Results: Atrophy in mesial and lateral temporal, isthmus cingulate, and orbitofrontal areas aided discrimination of HC subjects from subjects with AD, with fully cross-validated sensitivity of 83% and specificity of 93%. Subjects with MCI who had phenotypic AD atrophy showed significantly greater 1-year clinical decline and structural loss than those who did not and were more likely to have progression to probable AD (annual progression rate of 29% for subjects with MCI who had AD atrophy vs 8% for those who did not).
Conclusion: Semiautomated, individually specific quantitative MR imaging methods can be used to identify a pattern of regional atrophy in MCI that is predictive of clinical decline. Such information may aid in prediction of patient prognosis and increase the efficiency of clinical trials.
Figures


Similar articles
-
Baseline and longitudinal patterns of brain atrophy in MCI patients, and their use in prediction of short-term conversion to AD: results from ADNI.Neuroimage. 2009 Feb 15;44(4):1415-22. doi: 10.1016/j.neuroimage.2008.10.031. Epub 2008 Nov 5. Neuroimage. 2009. PMID: 19027862 Free PMC article.
-
Visual rating system for assessing magnetic resonance images: a tool in the diagnosis of mild cognitive impairment and Alzheimer disease.J Comput Assist Tomogr. 2009 Jan-Feb;33(1):73-8. doi: 10.1097/RCT.0b013e31816373d8. J Comput Assist Tomogr. 2009. PMID: 19188789
-
Discrimination between Alzheimer disease, mild cognitive impairment, and normal aging by using automated segmentation of the hippocampus.Radiology. 2008 Jul;248(1):194-201. doi: 10.1148/radiol.2481070876. Epub 2008 May 5. Radiology. 2008. PMID: 18458242
-
Structural neuroimaging in the detection and prognosis of pre-clinical and early AD.Behav Neurol. 2009;21(1):3-12. doi: 10.3233/BEN-2009-0230. Behav Neurol. 2009. PMID: 19847040 Free PMC article. Review.
-
Mapping progressive brain structural changes in early Alzheimer's disease and mild cognitive impairment.Neuropsychologia. 2008;46(6):1597-612. doi: 10.1016/j.neuropsychologia.2007.10.026. Epub 2007 Dec 14. Neuropsychologia. 2008. PMID: 18395760 Free PMC article. Review.
Cited by
-
Cortical signatures of cognition and their relationship to Alzheimer's disease.Brain Imaging Behav. 2012 Dec;6(4):584-98. doi: 10.1007/s11682-012-9180-5. Brain Imaging Behav. 2012. PMID: 22718430 Free PMC article.
-
Calculating stage duration statistics in multistage diseases.PLoS One. 2011;6(12):e28298. doi: 10.1371/journal.pone.0028298. Epub 2011 Dec 7. PLoS One. 2011. PMID: 22163291 Free PMC article.
-
A Hybrid Deep Learning Method for Early and Late Mild Cognitive Impairment Diagnosis With Incomplete Multimodal Data.Front Neuroinform. 2022 Mar 15;16:843566. doi: 10.3389/fninf.2022.843566. eCollection 2022. Front Neuroinform. 2022. PMID: 35370588 Free PMC article.
-
DTI and MR Volumetry of Hippocampus-PC/PCC Circuit: In Search of Early Micro- and Macrostructural Signs of Alzheimers's Disease.Neurol Res Int. 2012;2012:517876. doi: 10.1155/2012/517876. Epub 2011 Jun 12. Neurol Res Int. 2012. PMID: 21773026 Free PMC article.
-
Recent Advancements in Pathogenesis, Diagnostics and Treatment of Alzheimer's Disease.Curr Neuropharmacol. 2020;18(11):1106-1125. doi: 10.2174/1570159X18666200528142429. Curr Neuropharmacol. 2020. PMID: 32484110 Free PMC article. Review.
References
-
- Morris JC, Storandt M, Miller JP, et al. Mild cognitive impairment represents early-stage Alzheimer disease. Arch Neurol 2001;58:397–405. - PubMed
-
- Petersen RC. Mild cognitive impairment as a diagnostic entity. J Intern Med 2004;256:183–194. - PubMed
-
- Petersen RC, Bennett D. Mild cognitive impairment: is it Alzheimer's disease or not? J Alzheimers Dis 2005;7:241–245. - PubMed
-
- Ramani A, Jensen JH, Helpern JA. Quantitative MR imaging in Alzheimer disease. Radiology 2006;241:26–44. - PubMed
Publication types
MeSH terms
Grants and funding
LinkOut - more resources
Full Text Sources
Other Literature Sources
Medical
