Quantitative measurement of varicella-zoster virus infection by semiautomated flow cytometry
- PMID: 19201967
- PMCID: PMC2663199
- DOI: 10.1128/AEM.02006-08
Quantitative measurement of varicella-zoster virus infection by semiautomated flow cytometry
Abstract
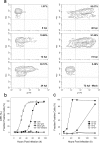
Varicella-zoster virus (VZV; human herpesvirus 3) is the etiological cause of chickenpox and, upon reactivation from latency, zoster. Currently, vaccines are available to prevent both diseases effectively. A critical requirement for the manufacturing of safe and potent vaccines is the measurement of the biological activity to ensure proper dosing and efficacy, while minimizing potentially harmful secondary effects induced by immunization. In the case of live virus-containing vaccines, such as VZV-containing vaccines, biological activity is determined using an infectivity assay in a susceptible cellular host in vitro. Infectivity measurements generally rely on the enumeration of plaques by visual inspection of an infected cell monolayer. These plaque assays are generally very tedious and labor intensive and have modest throughput and high associated variability. In this study, we have developed a flow cytometry assay to measure the infectivity of the attenuated vaccine strain (vOka/Merck) of VZV in MRC-5 cells with improved throughput. The assay is performed in 96-well tissue culture microtiter plates and is based on the detection and quantification of infected cells expressing VZV glycoproteins on their surfaces. Multiple assay parameters have been investigated, including specificity, limit of detection, limit of quantification, range of linear response, signal-to-noise ratio, and precision. This novel assay appears to be in good concordance with the classical plaque assay results and therefore provides a viable, higher-throughput alternative to the plaque assay.
Figures


Similar articles
-
Rapid automation of a cell-based assay using a modular approach: case study of a flow-based Varicella Zoster Virus infectivity assay.J Virol Methods. 2010 Jun;166(1-2):1-11. doi: 10.1016/j.jviromet.2010.01.016. Epub 2010 Feb 1. J Virol Methods. 2010. PMID: 20117140
-
Comparison of the Whole-Genome Sequence of an Oka Varicella Vaccine from China with Other Oka Vaccine Strains Reveals Sites Putatively Critical for Vaccine Efficacy.J Virol. 2019 Apr 17;93(9):e02281-18. doi: 10.1128/JVI.02281-18. Print 2019 May 1. J Virol. 2019. PMID: 30728261 Free PMC article.
-
A real-time PCR assay for the detection of varicella-zoster virus DNA and differentiation of vaccine, wild-type and control strains.J Virol Methods. 2003 Nov;113(2):113-6. doi: 10.1016/s0166-0934(03)00229-5. J Virol Methods. 2003. PMID: 14553897
-
The safety profile of varicella vaccine: a 10-year review.J Infect Dis. 2008 Mar 1;197 Suppl 2:S165-9. doi: 10.1086/522125. J Infect Dis. 2008. PMID: 18419392 Review.
-
Varicella-zoster virus.Clin Microbiol Rev. 1996 Jul;9(3):361-81. doi: 10.1128/CMR.9.3.361. Clin Microbiol Rev. 1996. PMID: 8809466 Free PMC article. Review.
Cited by
-
FlowFP: A Bioconductor Package for Fingerprinting Flow Cytometric Data.Adv Bioinformatics. 2009;2009:193947. doi: 10.1155/2009/193947. Epub 2009 Sep 24. Adv Bioinformatics. 2009. PMID: 19956416 Free PMC article.
-
Identification of a varicella-zoster virus replication inhibitor that blocks capsid assembly by interacting with the floor domain of the major capsid protein.J Virol. 2012 Nov;86(22):12198-207. doi: 10.1128/JVI.01280-12. Epub 2012 Aug 29. J Virol. 2012. PMID: 22933294 Free PMC article.
-
Rapid titration of measles and other viruses: optimization with determination of replication cycle length.PLoS One. 2011;6(9):e24135. doi: 10.1371/journal.pone.0024135. Epub 2011 Sep 7. PLoS One. 2011. PMID: 21915289 Free PMC article.
References
-
- Arvin, A. M. 1996. Immune responses to varicella-zoster virus. Infect. Dis. Clin. N. Am. 10:529-570. - PubMed
-
- Bajpai, R., J. Lesperance, M. Kim, and A. V. Terskikh. 2008. Efficient propagation of single cells Accutase-dissociated human embryonic stem cells. Mol. Reprod. Dev. 75:818-827. - PubMed
-
- Bordignon, J., S. C. P. Ferreira, G. M. M. Caporale, M. L. Carrieri, I. Kotait, H. C. Lima, and C. R. Zanetti. 2002. Flow cytometry assay for intracellular rabies virus detection. J. Virol. Methods 105:181-186. - PubMed
-
- Casella, G., and R. L. Berger. 2001. A least squares solution, p. 581-583. Statistical inference, 2nd ed. Duxbury Press, Pacific Grove, CA.
Publication types
MeSH terms
Substances
LinkOut - more resources
Full Text Sources
Other Literature Sources

