. 2009 Feb 24;106(8):2945-50.
doi: 10.1073/pnas.0811017106. Epub 2009 Feb 6.

Counting the number of releasable synaptic vesicles in a presynaptic terminal

Affiliations

Counting the number of releasable synaptic vesicles in a presynaptic terminal

Kaori Ikeda et al. Proc Natl Acad Sci U S A. .

Abstract

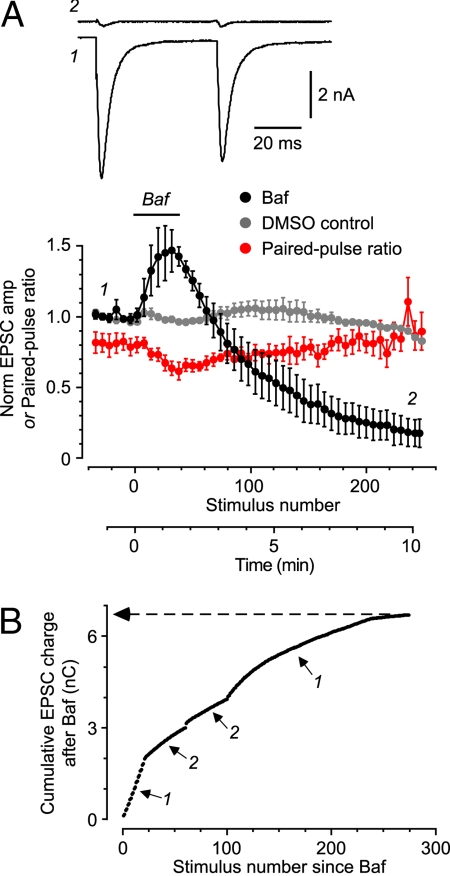
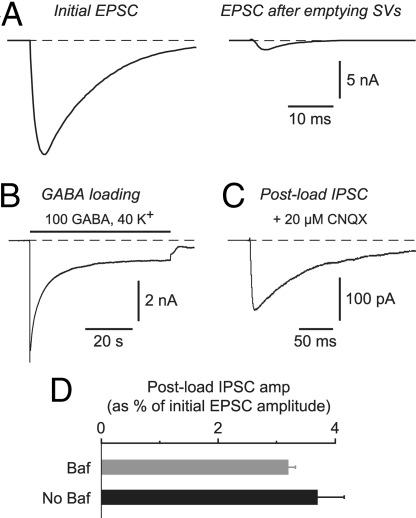
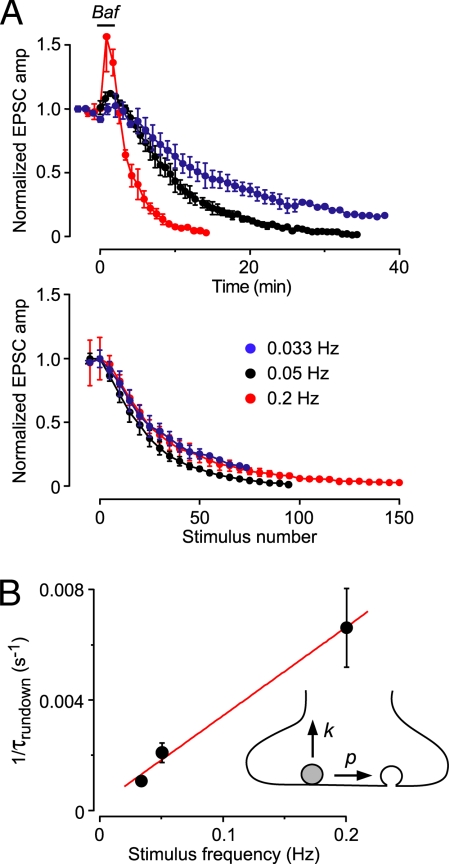
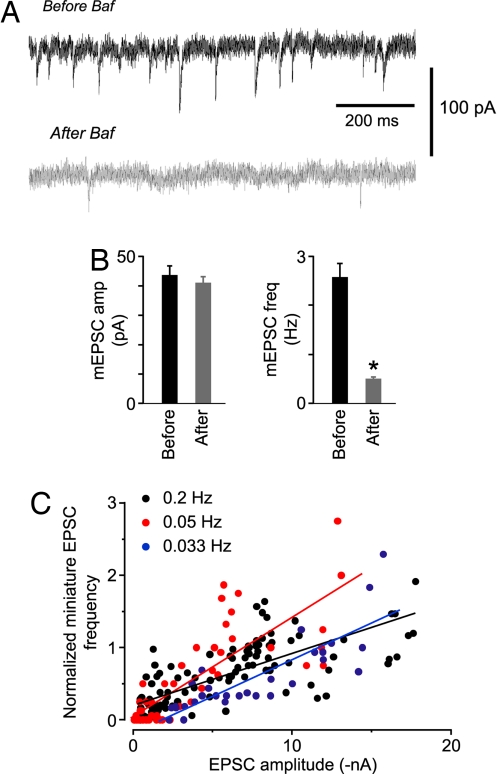
Synaptic transmission depends on the continued availability of neurotransmitter-filled synaptic vesicles (SVs) for triggered release from presynaptic boutons. Surprisingly, small boutons in the brain, that already contain comparatively few SVs, are thought to retain the majority of these SVs in a "reserve" pool that is not mobilized under physiological conditions. Why such a scarce synaptic resource is normally inaccessible has been a matter of debate. Here, we readdress this issue by developing an electrophysiological approach for counting SVs released from boutons formed by a single, isolated neuron on itself ("autapses"). We show that, after treatment with Bafilomycin A1 to prevent reloading of discharged SVs with glutamate, each SV is counted only once on first-time release. Hence, by integrating all autaptic currents as they run down over time, we can estimate the total number of SVs released by a single neuron. This total can be normalized to the number of boutons on the neuron, giving the mean number of SVs released per bouton. We estimate that up to approximately 130 vesicles can be released per bouton over approximately 10 min of stimulation at 0.2 Hz. This number of vesicles represents a substantial proportion of the total number of SVs (100-200) that have been counted in these boutons by using electron microscopy. Thus, mild electrical stimulation, when maintained for sufficient time, causes the eventual release of many of the SVs in a bouton, including those in the putative reserve pool. This result suggests that SVs are functionally homogeneous in that the majority can contribute to basal synaptic transmission.


Conflict of interest statement

The authors declare no conflict of interest.

Figures

Fig. 1.
Fig. 1.
Acute Baf treatment causes irreversible, stimulus-dependent loss of glutamate-containing SVs and can be used to count the total number of SVs that are released. (A Upper) Typical pairs of EPSCs measured before Baf treatment (trace 1) and after stimulating for 8.5 min after Baf application (trace 2). Stimulus transients have been blanked. (Lower) Mean normalized EPSC amplitude (Baf-treated, black circles; DMSO control, gray circles) or paired-pulse ratio for Baf-treated EPSCs (red circles) plotted against stimulus number (average of n = 4 cells, all with paired stimuli repeated at 0.2 Hz). Baf and/or DMSO was applied by puffer during the period indicated by the horizontal bar. The numbers on the plot indicate the times at which the example EPSCs were recorded. (B) Cumulative EPSC charge measured in a typical cell after Baf treatment, plotted against stimulus number. Periods 1: paired stimulation at 0.2 Hz; periods 2: 2-s, 20 Hz train. Asymptotic level is indicated (6.70 nC, dashed line).
Fig. 2.
Fig. 2.
The SV cycle functions normally after Baf-produced depletion of vesicular glutamate, as confirmed by the ability to load a normal amount of exogenous GABA into SVs by endocytosis and to release it again by exocytosis. (A) Autaptic EPSC measured at the beginning of the experiment (Left) and after puffing on Baf and stimulating for 10 min at 0.2 Hz to empty glutamate from the SVs (Right). (B) Response of the same cell (after emptying SVs) to a 60-s application of GABA loading solution containing 100 mM GABA. An inward current was produced because the internal solution contained high chloride. (C) Postload IPSC recorded in the same cell as in A and B after washing out the GABA loading solution and blocking any residual EPSC with 20 μM CNQX. This postload IPSC is due to the evoked release of endocytosed GABA onto postsynaptic GABAA receptors. (D) Amplitude of the postload IPSC, expressed as a percentage of the initial EPSC amplitude (e.g., A Left), for experiments in which SVs were first depleted of glutamate (Baf), or for control experiments in which Baf was not applied (No Baf). The two measures are not significantly different (P = 0.69), suggesting that vesicular endocytosis and exocytosis is unaffected by prior treatment with Baf.
Fig. 3.
Fig. 3.
Baf-treated SVs do not passively leak out glutamate. (A Upper) EPSC amplitudes evoked at different stimulus frequencies, normalized to the amplitude before Baf application, plotted against time (n = 2–5 cells). (Lower) The same EPSC amplitudes, normalized to the peak amplitude during Baf application to facilitate comparison, plotted against stimulus number. The plots vs. stimulus number all overlie, implicating a stimulus–dependent loss of glutamate from SVs. (B) The data in A can be described by a simple model that incorporates a stimulus-dependent probability of exocytosis (p, Inset) and a time-dependent passive leak of glutamate from SVs (k, Inset). A plot of the reciprocal of the time constant of rundown at different stimulus frequencies (from A Upper) vs. stimulus frequency can be fitted to Eq. 2 in the text (superimposed red line) to yield p = 0.032 and k = 0.00024 s−1. Thus, passive leakage of glutamate from SVs is very slow. Error bars are ±SD (smaller than symbol at 0.033 Hz).
Fig. 4.
Fig. 4.
Properties of mEPSCs suggest that, after Baf application and stimulation, SVs are either completely full or completely empty. Moreover, evoked EPSCs and mEPSCs appear to draw from the same pool of SVs. (A) Typical mEPSCs recorded in the same cell before (Upper) or ≈10 min after (Lower) stimulation after the acute application of Baf. (B) Mean mEPSC amplitude (Left) and frequency (Right) measured before and after Baf-induced rundown of evoked EPSCs. Only the frequencies were significantly different (n = 6 cells; P = 0.015). (C) Normalized frequency of mEPSCs plotted against the amplitude of the immediately preceding EPSC, recorded during Baf-induced rundown of the EPSC amplitude. For any one cell, the points initially lie in the upper right corner of the plot then move toward the origin as rundown proceeds. Points of the same color are the merged data from a number of cells that were stimulated at the indicated frequency (0.2 Hz: n = 4; 0.05 Hz: n = 2; 0.033 Hz: n = 2). Superimposed straight lines are fits to all points of the same color. Their slopes are not significantly different (P > 0.1).
Fig. 5.
Fig. 5.
Two methods can be used for estimating the number of synaptic boutons per cell, to enable calculation of the number of SVs released per bouton. (A and B) Method using train and sucrose application to estimate the total size of the RRP of vesicles and hence the number of boutons. (A Upper) EPSCs evoked by a train of 40 stimuli at 20 Hz (cell not exposed to Baf). Stimulus transients have been blanked. (Lower) Cumulative EPSC charge plotted against time during the train for the data shown in the Upper image. The superimposed straight line (gray) is fitted to the points after 1.5 s. Extrapolated to 0 time, the intercept yields one estimate of the total RRP size for this cell. (B Upper) Response of the cell in A to a 6-s application of external solution made hypertonic by the addition of 500 mM sucrose. The area of the transient part of this response provides another estimate of the total RRP size. (Lower) Plot of RRP size estimated from the sucrose method vs. that from the train method. Each point is from a different cell (n = 6). The superimposed gray line is a linear fit constrained through the origin with a slope of 1.56. This provides a scale factor for estimating the number of synaptic boutons from trains (see Results). (C and D) Method using the variance-mean (V–M) fluctuation analysis technique to estimate the number of synaptic release sites, N. (C) Data from a typical V-M experiment. (Upper) representative EPSCs recorded from the same cell in bath solution containing the indicated Ca2+ concentration (in mM). Stimulus transients have been blanked. (Lower) Plot of the variance of fluctuations in EPSC amplitude vs. the mean amplitude of EPSCs recorded in each Ca2+ concentration. The superimposed smooth curve is a parabola (Eq. 1), which gives N (175 ± 27 for this cell). Error bars are ±SD. (D) Plot of N estimated amplitude measured in the same cell in external solution containing 2 mM Ca2+ and 1 mM Mg2+. Each point is from a different cell (n = 6). Superimposed gray line is a linear fit constrained through the origin with a slope of 34.4. This provides a scale factor for estimating the number of synaptic release sites, knowing the mean EPSC amplitude before Baf.

References

    1. Rizzoli SO, Betz WJ. Synaptic vesicle pools. Nat Rev Neurosci. 2005;6:57–69. - PubMed
    1. Schikorski T, Stevens CF. Quantitative ultrastructural analysis of hippocampal excitatory synapses. J Neurosci. 1997;17:5858–5867. - PMC - PubMed
    1. Micheva KD, Smith SJ. Strong effects of subphysiological temperature on the function and plasticity of mammalian presynaptic terminals. J Neurosci. 2005;25:7481–7488. - PMC - PubMed
    1. Schweizer FE, Ryan TA. The synaptic vesicle: Cycle of exocytosis and endocytosis. Curr Opin Neurobiol. 2006;16:298–304. - PubMed
    1. Fernandez-Alfonso T, Ryan TA. The efficiency of the synaptic vesicle cycle at central nervous system synapses. Trends Cell Biol. 2006;16:413–420. - PubMed

Publication types

LinkOut - more resources