

Potassium softens vascular endothelium and increases nitric oxide release
- PMID: 19202069
- PMCID: PMC2637279
- DOI: 10.1073/pnas.0813069106
Potassium softens vascular endothelium and increases nitric oxide release
Abstract
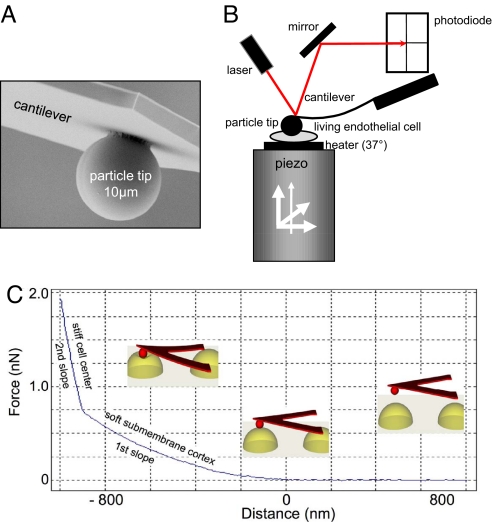
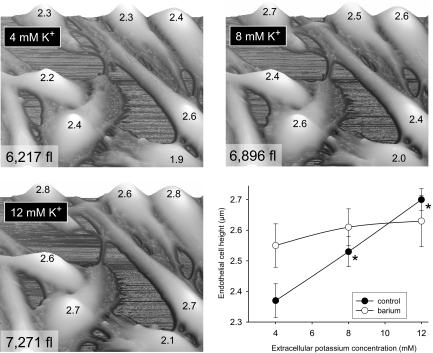
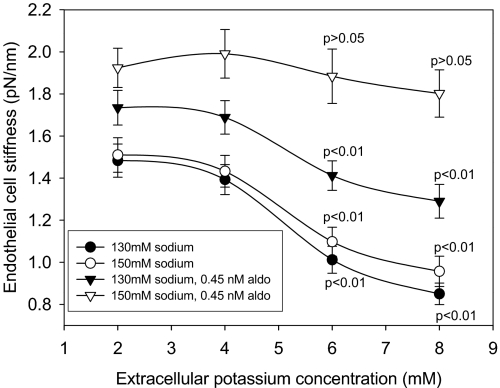
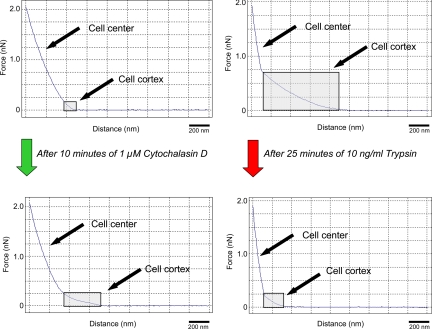
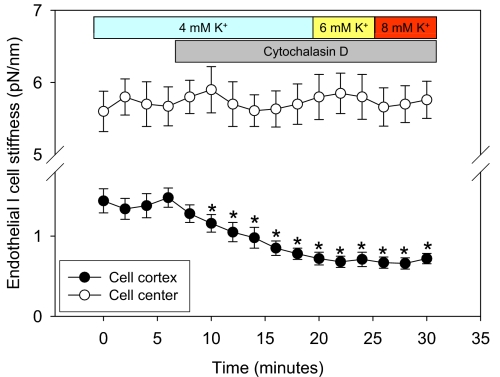
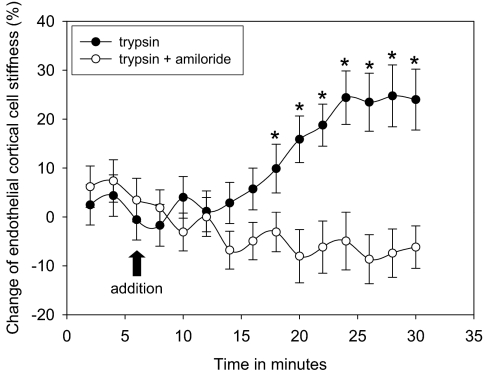
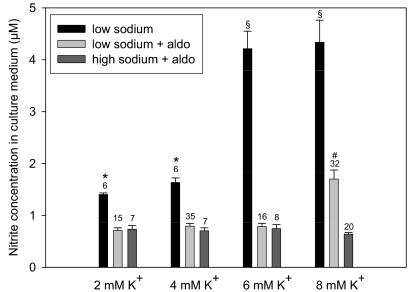
In the presence of aldosterone, plasma sodium in the high physiological range stiffens endothelial cells and reduces the release of nitric oxide. We now demonstrate effects of extracellular potassium on stiffness of individual cultured bovine aortic endothelial cells by using the tip of an atomic force microscope as a mechanical nanosensor. An acute increase of potassium in the physiological range swells and softens the endothelial cell and increases the release of nitric oxide. A high physiological sodium concentration, in the presence of aldosterone, prevents these changes. We propose that the potassium effects are caused by submembranous cortical fluidization because cortical actin depolymerization induced by cytochalasin D mimics the effect of high potassium. In contrast, a low dose of trypsin, known to activate sodium influx through epithelial sodium channels, stiffens the submembranous cell cortex. Obviously, the cortical actin cytoskeleton switches from gelation to solation depending on the ambient sodium and potassium concentrations, whereas the center of the cell is not involved. Such a mechanism would control endothelial deformability and nitric oxide release, and thus influence systemic blood pressure.
Conflict of interest statement
The authors declare no conflict of interest.
Figures
Similar articles
-
Cortical actin nanodynamics determines nitric oxide release in vascular endothelium.PLoS One. 2012;7(7):e41520. doi: 10.1371/journal.pone.0041520. Epub 2012 Jul 23. PLoS One. 2012. PMID: 22844486 Free PMC article.
-
Plasma sodium stiffens vascular endothelium and reduces nitric oxide release.Proc Natl Acad Sci U S A. 2007 Oct 9;104(41):16281-6. doi: 10.1073/pnas.0707791104. Epub 2007 Oct 2. Proc Natl Acad Sci U S A. 2007. PMID: 17911245 Free PMC article.
-
Aldosterone synthase knockout mouse as a model for sodium-induced endothelial sodium channel up-regulation in vascular endothelium.FASEB J. 2016 Jan;30(1):45-53. doi: 10.1096/fj.14-259606. Epub 2015 Aug 31. FASEB J. 2016. PMID: 26324851
-
Endothelial cells as vascular salt sensors.Kidney Int. 2010 Mar;77(6):490-4. doi: 10.1038/ki.2009.490. Epub 2010 Jan 6. Kidney Int. 2010. PMID: 20054292 Review.
-
Ménage à trois: aldosterone, sodium and nitric oxide in vascular endothelium.Biochim Biophys Acta. 2010 Dec;1802(12):1193-202. doi: 10.1016/j.bbadis.2010.03.006. Epub 2010 Mar 17. Biochim Biophys Acta. 2010. PMID: 20302930 Review.
Cited by
-
Regular Exercise Reduces Endothelial Cortical Stiffness in Western Diet-Fed Female Mice.Hypertension. 2016 Nov;68(5):1236-1244. doi: 10.1161/HYPERTENSIONAHA.116.07954. Epub 2016 Aug 29. Hypertension. 2016. PMID: 27572153 Free PMC article.
-
Effects of Morphology vs. Cell-Cell Interactions on Endothelial Cell Stiffness.Cell Mol Bioeng. 2011 Mar 1;4(1):9-27. doi: 10.1007/s12195-010-0142-y. Cell Mol Bioeng. 2011. PMID: 21359128 Free PMC article.
-
Nitric oxide release follows endothelial nanomechanics and not vice versa.Pflugers Arch. 2010 Oct;460(5):915-23. doi: 10.1007/s00424-010-0871-8. Epub 2010 Sep 1. Pflugers Arch. 2010. PMID: 20809399
-
A Critical Review on Vasoactive Nutrients for the Management of Endothelial Dysfunction and Arterial Stiffness in Individuals under Cardiovascular Risk.Nutrients. 2023 Jun 2;15(11):2618. doi: 10.3390/nu15112618. Nutrients. 2023. PMID: 37299579 Free PMC article. Review.
-
Early reduction of skin potassium without sodium accumulation in the pathogenesis of salt sensitivity in primary aldosteronism.Front Pharmacol. 2025 Apr 29;16:1575972. doi: 10.3389/fphar.2025.1575972. eCollection 2025. Front Pharmacol. 2025. PMID: 40365307 Free PMC article.
References
-
- Roson MI, et al. Acute sodium overload produces renal tubulointerstitial inflammation in normal rats. Kidney Int. 2006;70:1439–1446. - PubMed
-
- Ni Z, Vaziri ND. Effect of salt loading on nitric oxide synthase expression in normotensive rats. Am J Hypertens. 2001;14:155–163. - PubMed
-
- Mercier N, et al. Sodium, arterial stiffness, and cardiovascular mortality in hypertensive rats. Am J Hypertens. 2007;20:319–325. - PubMed
-
- Frohlich ED, Varagic J. Sodium directly impairs target organ function in hypertension. Curr Opin Cardiol. 2005;20:424–429. - PubMed
-
- Adrogue HJ, Madias NE. Sodium and potassium in the pathogenesis of hypertension. N Engl J Med. 2007;356:1966–1978. - PubMed
Publication types
MeSH terms
Substances
LinkOut - more resources
Full Text Sources
Other Literature Sources
Medical
