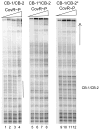
Regulation of streptokinase expression by CovR/S in Streptococcus pyogenes: CovR acts through a single high-affinity binding site
- PMID: 19202105
- PMCID: PMC4130213
- DOI: 10.1099/mic.0.024620-0
Regulation of streptokinase expression by CovR/S in Streptococcus pyogenes: CovR acts through a single high-affinity binding site
Abstract
The important human pathogen Streptococcus pyogenes (the group A streptococcus or GAS) produces many virulence factors that are regulated by the two-component signal transduction system CovRS (CsrRS). Dissemination of GAS infection originating at the skin has been shown to require production of streptokinase, whose transcription is repressed by CovR. In this work we have studied the interaction of CovR and phosphorylated CovR (CovR-P) with the promoter for streptokinase, Pska. We found that, in contrast to the other CovR-repressed promoters, Pska regulation by CovR occurs through binding at a single ATTARA consensus binding sequence (CB) that overlaps the -10 region of the promoter. Binding of CovR to other nearby consensus sequences occurs upon phosphorylation of the protein, but these other CBs do not contribute to the regulation of Pska by CovR. Thus, binding at a specific site does not necessarily indicate that the site is involved in regulation by CovR. In addition, at Pska, CovR binding to the different sites does not appear to involve cooperative interactions, which simplifies the analysis of CovR binding and gives us insight into the modes of interaction that occur between CovR and its specific DNA-binding sites. Finally, the observation that regulation of transcription from Pska occurs at a very low concentration of phosphorylated CovR may have important implications for the regulation of virulence gene expression during GAS infection.
Figures


Similar articles
-
Binding of the global response regulator protein CovR to the sag promoter of Streptococcus pyogenes reveals a new mode of CovR-DNA interaction.J Biol Chem. 2005 Nov 25;280(47):38948-56. doi: 10.1074/jbc.M506121200. Epub 2005 Sep 20. J Biol Chem. 2005. PMID: 16174772
-
A natural inactivating mutation in the CovS component of the CovRS regulatory operon in a pattern D Streptococcal pyogenes strain influences virulence-associated genes.J Biol Chem. 2013 Mar 1;288(9):6561-73. doi: 10.1074/jbc.M112.442657. Epub 2013 Jan 13. J Biol Chem. 2013. PMID: 23316057 Free PMC article.
-
Use of a Phosphorylation Site Mutant To Identify Distinct Modes of Gene Repression by the Control of Virulence Regulator (CovR) in Streptococcus pyogenes.J Bacteriol. 2017 Aug 22;199(18):e00835-16. doi: 10.1128/JB.00835-16. Print 2017 Sep 15. J Bacteriol. 2017. PMID: 28289082 Free PMC article.
-
The two faces of Janus: virulence gene regulation by CovR/S in group A streptococci.Mol Microbiol. 2007 Apr;64(1):34-41. doi: 10.1111/j.1365-2958.2007.05649.x. Mol Microbiol. 2007. PMID: 17376070 Review.
-
Cellular interactions of covR/S mutant group A Streptococci.Microbes Infect. 2018 Oct-Nov;20(9-10):531-535. doi: 10.1016/j.micinf.2017.12.009. Epub 2017 Dec 26. Microbes Infect. 2018. PMID: 29287985 Review.
Cited by
-
Repression of Rgg But Not Upregulation of LacD.1 in emm1-type covS Mutant Mediates the SpeB Repression in Group A Streptococcus.Front Microbiol. 2016 Nov 29;7:1935. doi: 10.3389/fmicb.2016.01935. eCollection 2016. Front Microbiol. 2016. PMID: 27965655 Free PMC article.
-
A Novel CovS Variant Harbored by a Colonization Strain Reduces Streptococcus pyogenes Virulence.J Bacteriol. 2023 Apr 25;205(4):e0003923. doi: 10.1128/jb.00039-23. Epub 2023 Mar 15. J Bacteriol. 2023. PMID: 36920220 Free PMC article.
-
RocA Is an Accessory Protein to the Virulence-Regulating CovRS Two-Component System in Group A Streptococcus.Infect Immun. 2017 Oct 18;85(11):e00274-17. doi: 10.1128/IAI.00274-17. Print 2017 Nov. Infect Immun. 2017. PMID: 28808155 Free PMC article.
-
CovR and VicRK regulate cell surface biogenesis genes required for biofilm formation in Streptococcus mutans.PLoS One. 2013;8(3):e58271. doi: 10.1371/journal.pone.0058271. Epub 2013 Mar 12. PLoS One. 2013. PMID: 23554881 Free PMC article.
-
Generation of metabolically diverse strains of Streptococcus pyogenes during survival in stationary phase.J Bacteriol. 2009 Oct;191(20):6242-52. doi: 10.1128/JB.00440-09. Epub 2009 Aug 7. J Bacteriol. 2009. PMID: 19666718 Free PMC article.
References
-
- Ashbaugh CD, Moser TJ, Shearer MH, White GL, Kennedy RC, Wessels MR. Bacterial determinants of persistent throat colonization and the associated immune response in a primate model of human group A streptococcal pharyngeal infection. Cellular Microbiology. 2000;2:283–292. - PubMed
-
- Brinkmann V, Reichard U, Goosmann C, Fauler B, Uhlemann Y, Weiss DS, Weinrauch Y, Zychlinsky A. Neutrophil extracellular traps kill bacteria. Science. 2004;303:1532–1535. - PubMed
-
- Buchanan JT, Simpson AJ, Aziz RK, Liu GY, Kristian SA, Kotb M, Feramisco J, Nizet V. DNase expression allows the pathogen group A Streptococcus to escape killing in neutrophil extracellular traps. Curr Biol. 2006;16:396–400. - PubMed
-
- Churchward G. The two faces of Janus: virulence gene regulation by CovR/S in group A streptococci. Mol Microbiol. 2007;64:34–41. - PubMed
-
- Cole JN, McArthur JD, McKay FC, et al. Trigger for group A streptococcal M1T1 invasive disease. Faseb J. 2006;20:1745–1747. - PubMed
Publication types
MeSH terms
Substances
Grants and funding
LinkOut - more resources
Full Text Sources

