Assessing susceptibility to age-related macular degeneration with proteomic and genomic biomarkers
- PMID: 19202148
- PMCID: PMC2690477
- DOI: 10.1074/mcp.M800453-MCP200
Assessing susceptibility to age-related macular degeneration with proteomic and genomic biomarkers
Abstract
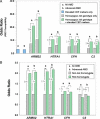
Age-related macular degeneration (AMD) is a progressive disease and major cause of severe visual loss. Toward the discovery of tools for early identification of AMD susceptibility, we evaluated the combined predictive capability of proteomic and genomic AMD biomarkers. We quantified plasma carboxyethylpyrrole (CEP) oxidative protein modifications and CEP autoantibodies by ELISA in 916 AMD and 488 control donors. CEP adducts are uniquely generated from oxidation of docosahexaenoate-containing lipids that are abundant in the retina. Mean CEP adduct and autoantibody levels were found to be elevated in AMD plasma by approximately 60 and approximately 30%, respectively. The odds ratio for both CEP markers elevated was 3-fold greater or more in AMD than in control patients. Genotyping was performed for AMD risk polymorphisms associated with age-related maculopathy susceptibility 2 (ARMS2), high temperature requirement factor A1 (HTRA1), complement factor H, and complement C3, and the risk of AMD was predicted based on genotype alone or in combination with the CEP markers. The AMD risk predicted for those exhibiting elevated CEP markers and risk genotypes was 2-3-fold greater than the risk based on genotype alone. AMD donors carrying the ARMS2 and HTRA1 risk alleles were the most likely to exhibit elevated CEP markers. The results compellingly demonstrate higher mean CEP marker levels in AMD plasma over a broad age range. Receiver operating characteristic curves suggest that CEP markers alone can discriminate between AMD and control plasma donors with approximately 76% accuracy and in combination with genomic markers provide up to approximately 80% discrimination accuracy. Plasma CEP marker levels were altered slightly by several demographic and health factors that warrant further study. We conclude that CEP plasma biomarkers, particularly in combination with genomic markers, offer a potential early warning system for assessing susceptibility to this blinding, multifactorial disease.
Figures


Similar articles
-
Proteomic and genomic biomarkers for age-related macular degeneration.Adv Exp Med Biol. 2010;664:411-7. doi: 10.1007/978-1-4419-1399-9_47. Adv Exp Med Biol. 2010. PMID: 20238042
-
Plasma protein pentosidine and carboxymethyllysine, biomarkers for age-related macular degeneration.Mol Cell Proteomics. 2009 Aug;8(8):1921-33. doi: 10.1074/mcp.M900127-MCP200. Epub 2009 May 11. Mol Cell Proteomics. 2009. PMID: 19435712 Free PMC article.
-
Carboxyethylpyrrole protein adducts and autoantibodies, biomarkers for age-related macular degeneration.J Biol Chem. 2003 Oct 24;278(43):42027-35. doi: 10.1074/jbc.M305460200. Epub 2003 Aug 15. J Biol Chem. 2003. PMID: 12923198
-
LOC387715/HTRA1 gene polymorphisms and susceptibility to age-related macular degeneration: A HuGE review and meta-analysis.Mol Vis. 2010 Oct 5;16:1958-81. Mol Vis. 2010. PMID: 21031019 Free PMC article. Review.
-
Genomic aspects of age-related macular degeneration.Biochem Biophys Res Commun. 2014 Sep 19;452(2):263-75. doi: 10.1016/j.bbrc.2014.08.013. Epub 2014 Aug 8. Biochem Biophys Res Commun. 2014. PMID: 25111812 Review.
Cited by
-
The association between complement component 2/complement factor B polymorphisms and age-related macular degeneration: a HuGE review and meta-analysis.Am J Epidemiol. 2012 Sep 1;176(5):361-72. doi: 10.1093/aje/kws031. Epub 2012 Aug 5. Am J Epidemiol. 2012. PMID: 22869612 Free PMC article.
-
Molecular biomarkers in glaucoma.Invest Ophthalmol Vis Sci. 2013 Jan 7;54(1):121-31. doi: 10.1167/iovs.12-11067. Invest Ophthalmol Vis Sci. 2013. PMID: 23297392 Free PMC article. No abstract available.
-
Biomarkers for Nonexudative Age-Related Macular Degeneration and Relevance for Clinical Trials: A Systematic Review.Mol Diagn Ther. 2021 Nov;25(6):691-713. doi: 10.1007/s40291-021-00551-5. Epub 2021 Aug 25. Mol Diagn Ther. 2021. PMID: 34432254
-
Risk factors and biomarkers of age-related macular degeneration.Prog Retin Eye Res. 2016 Sep;54:64-102. doi: 10.1016/j.preteyeres.2016.04.003. Epub 2016 May 6. Prog Retin Eye Res. 2016. PMID: 27156982 Free PMC article. Review.
-
Plasma biomarkers of oxidative stress and genetic variants in age-related macular degeneration.Am J Ophthalmol. 2012 Mar;153(3):460-467.e1. doi: 10.1016/j.ajo.2011.08.033. Epub 2011 Oct 29. Am J Ophthalmol. 2012. PMID: 22035603 Free PMC article.
References
-
- Jager, R. D., Mieler, W. F., and Miller, J. W. ( 2008) Age-related macular degeneration. N. Engl. J. Med. 358, 2606–2617 - PubMed
-
- Friedman, D. S., O'Colmain, B. J., Munoz, B., Tomany, S. C., McCarty, C., de Jong, P. T., Nemesure, B., Mitchell, P., and Kempen, J. ( 2004) Prevalence of age-related macular degeneration in the United States. Arch. Ophthalmol. 122, 564–572 - PubMed
-
- Edwards, A. O., Ritter, R., III, Abel, K. J., Manning, A., Panhuysen, C., and Farrer, L. A. ( 2005) Complement factor H polymorphism and age-related macular degeneration. Science 308, 421–424 - PubMed
-
- Hageman, G. S., Anderson, D. H., Johnson, L. V., Hancox, L. S., Taiber, A. J., Hardisty, L. I., Hageman, J. L., Stockman, H. A., Borchardt, J. D., Gehrs, K. M., Smith, R. J., Silvestri, G., Russell, S. R., Klaver, C. C., Barbazetto, I., Chang, S., Yannuzzi, L. A., Barile, G. R., Merriam, J. C., Smith, R. T., Olsh, A. K., Bergeron, J., Zernant, J., Merriam, J. E., Gold, B., Dean, M., and Allikmets, R. ( 2005) A common haplotype in the complement regulatory gene factor H (HF1/CFH) predisposes individuals to age-related macular degeneration. Proc. Natl. Acad. Sci. U. S. A. 102, 7227–7232 - PMC - PubMed
Publication types
MeSH terms
Substances
Grants and funding
LinkOut - more resources
Full Text Sources
Other Literature Sources
Medical
Miscellaneous

