

Programming of growth, insulin resistance and vascular dysfunction in offspring of late gestation diabetic rats
- PMID: 19203348
- PMCID: PMC2884292
- DOI: 10.1042/CS20080550
Programming of growth, insulin resistance and vascular dysfunction in offspring of late gestation diabetic rats
Abstract
ODM (offspring of diabetic mothers) have an increased risk of developing metabolic and cardiovascular dysfunction; however, few studies have focused on the susceptibility to disease in offspring of mothers developing diabetes during pregnancy. We developed an animal model of late gestation diabetic pregnancy and characterized metabolic and vascular function in the offspring. Diabetes was induced by streptozotocin (50 mg/kg of body weight, intraperitoneally) in pregnant rats on gestational day 13 and was partially controlled by twice-daily injections of insulin. At 2 months of age, ODM had slightly better glucose tolerance than controls (P<0.05); however, by 6 months of age this trend had reversed. A euglycaemic-hyperinsulinamic clamp revealed insulin resistance in male ODM (P<0.05). In 6-8-month-old female ODM, aortas had significantly enhanced contractility in response to KCl, ET-1 (endothelin-1) and NA (noradrenaline). No differences in responses to ET-1 and NA were apparent with co-administration of L-NNA (NG-nitro-L-arginine). Relaxation in response to ACh (acetylcholine), but not SNP (sodium nitroprusside), was significantly impaired in female ODM. In contrast, males had no between-group differences in response to vasoconstrictors, whereas relaxation to SNP and ACh was greater in ODM compared with control animals. Thus the development of diabetes during pregnancy programmes gender-specific insulin resistance and vascular dysfunction in adult offspring.
Figures

 ) on day 13 of gestation and sham controls (
 ). Glucose values represent average daily values. Values are means ± SE. (p < 0.05 between groups for all data points.) The mean values in the control groups ranged from 97.8 to 99.4 mg/dl with SE range of 2.73 - 4.08 mg/dl.
 ). The distribution is shown as a normalized frequency plot. Tick marks representing weights of each pup are shown below the x-axis. N, number of animals in each group.
 ), n = 17 at 2 and 5 months) and control (CON (), n = 19 at 2 and 5 months) and in male offspring of diabetic (n = 44 at 2 months, n = 42 at 5 months) and control (n = 39 at 2 months, n = 37 at 5 months) mothers. A, females at 2 months; B, males at months; C, females at 5 months; D, males at 5 months. Values are means ± SE. * p < 0.05 compared to control at same time point. Total area under the curve, as determined by the trapezoidal rule, was not significantly different between CON and ODM offspring for either gender at any age.
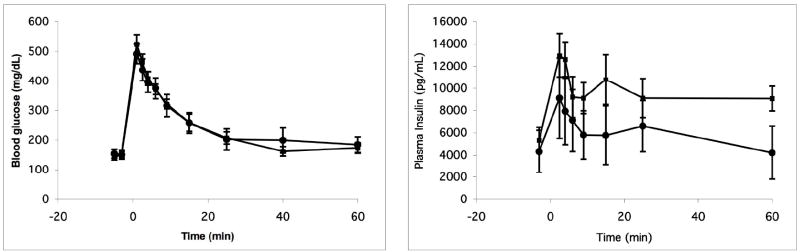 ), n = 6) or control (CON, n = 6 ()) rats. Values are means ± SE. No differences in any time point or in total area under the curve, as determined by the trapezoidal rule, were detected.
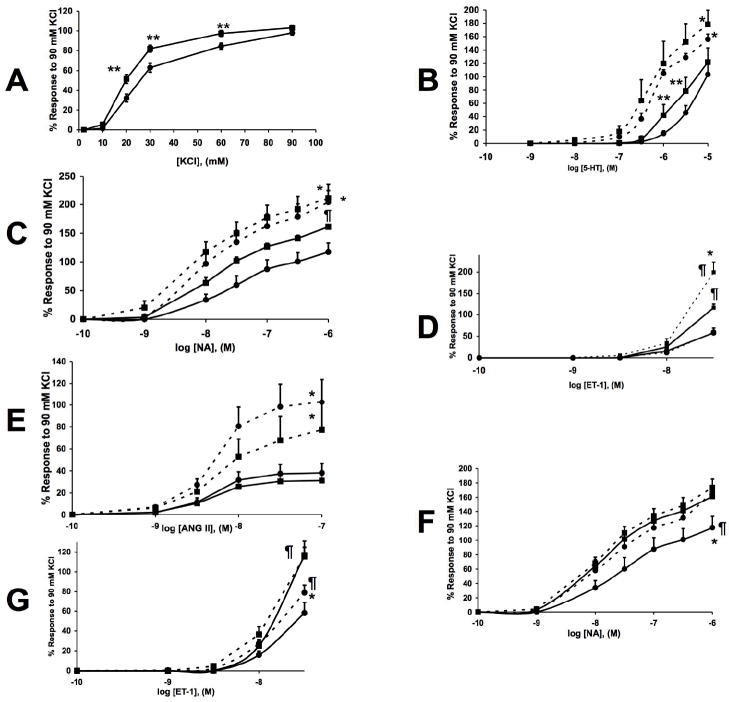 ), intact control (), rubbed ODM (
 ), rubbed control (
 ). For figures F,G: ODM (),control (),ODM + L-NNA (), control + L-NNA (). Values are means ± SE. ** p < 0.05 between endothelium intact ODM and intact control at specific concentrations. * p < 0.05 between rubbed and intact within same treatment groups (ANOVA). ¶ p < 0.05 between intact ODM and intact control (for all figures), or between rubbed ODM and rubbed control (figure B-E) or between L-NNA treated ODM and L-NNA treated controls (figures F,G) (treatment group effect, ANOVA).
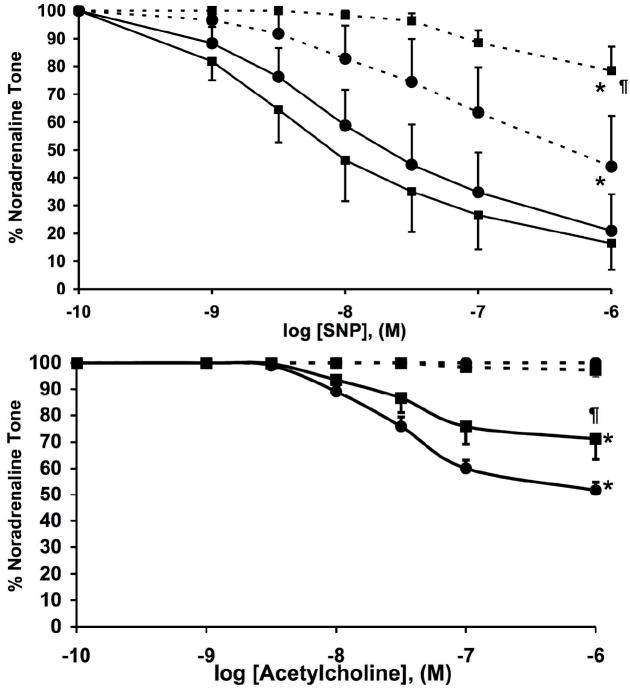 ), intact control (), rubbed ODM () and rubbed control (). Values are means ± SE. * p < 0.05 between intact and rubbed within same treatment group (ANOVA). ¶ p < 0.05 between intact ODM and intact control, or between rubbed ODM and rubbed control (treatment group effect, ANOVA).
 ), intact control (), rubbed ODM (), rubbed control (). For figures F,G: ODM (),control (),ODM + L-NNA (), control + L-NNA (). Values are means ± SE. * p < 0.05 between rubbed and intact within same treatment groups (ANOVA). ¶ p < 0.05 between intact ODM and intact control (for all figures), or between rubbed ODM and rubbed control (figure B-E) (treatment group effect, ANOVA).
 ), intact control (), rubbed ODM () and rubbed control (). Values are means ± SE. * p < 0.05 between intact and rubbed within same treatment group (ANOVA). ¶ p < 0.05 between intact ODM and intact control (treatment group effect, ANOVA).
References
-
- Curhan GC, Willett WC, Rimm EB, Spiegelman D, Ascherio AL, Stampfer MJ. Prevention of cardiovascular disease: birth weight and adult hypertension, diabetes mellitus, and obesity in US men. Circulation. 1996;94:3246–3250. - PubMed
-
- Rich-Edwards JW, Colditz GA, Stampfer MJ, Willett WC, Gillman MW, Hennekens CH, Speizer FE, Manson JE. Birthweight and the risk for type 2 diabetes mellitus in adult women. Annals of Internal Medicine. 1999;130:278–284. - PubMed
-
- Boney CM, Verma A, Tucker R, Vohr BR. Metabolic syndrome in childhood: association with birth weight, maternal obesity, and gestational diabetes mellitus. Pediatrics. 2005;115:e290–296. - PubMed
-
- Dabelea D, Hanson RL, Lindsay RS, Pettitt DJ, Imperatore G, Gabir MM, Roumain J, Bennett PH, Knowler WC. Intrauterine exposure to diabetes conveys risks for type 2 diabetes and obesity: a study of discordant sibships. Diabetes. 2000;49:2208–2211. - PubMed
Publication types
MeSH terms
Substances
Grants and funding
LinkOut - more resources
Full Text Sources
Medical