. 2009 Feb 9:10:73.
doi: 10.1186/1471-2164-10-73.

Three LIF-dependent signatures and gene clusters with atypical expression profiles, identified by transcriptome studies in mouse ES cells and early derivatives

Affiliations

Three LIF-dependent signatures and gene clusters with atypical expression profiles, identified by transcriptome studies in mouse ES cells and early derivatives

Marina Trouillas et al. BMC Genomics. .

Abstract

Background: Mouse embryonic stem (ES) cells remain pluripotent in vitro when grown in the presence of the cytokine Leukaemia Inhibitory Factor (LIF). Identification of LIF targets and of genes regulating the transition between pluripotent and early differentiated cells is a critical step for understanding the control of ES cell pluripotency.

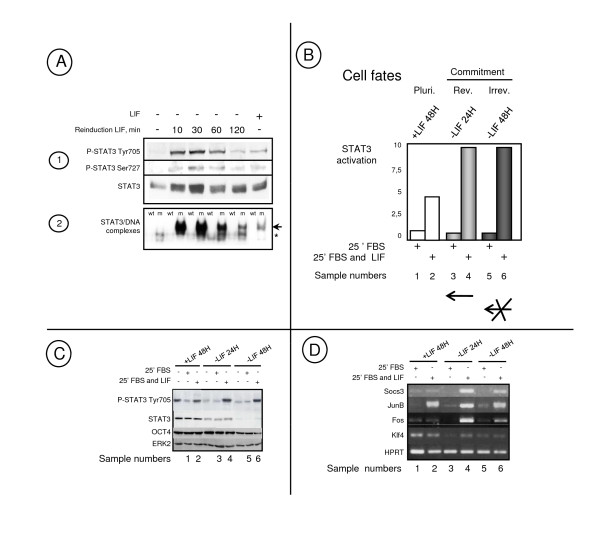
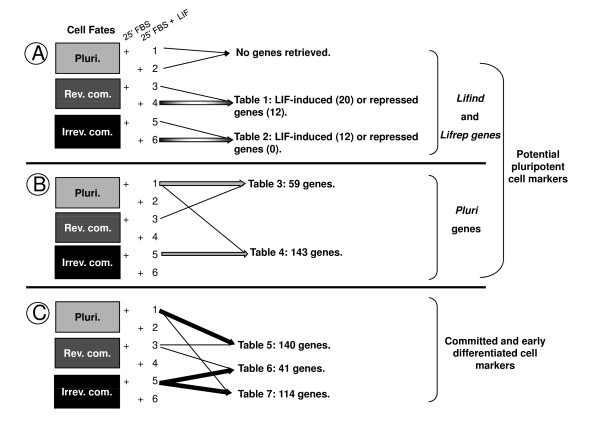
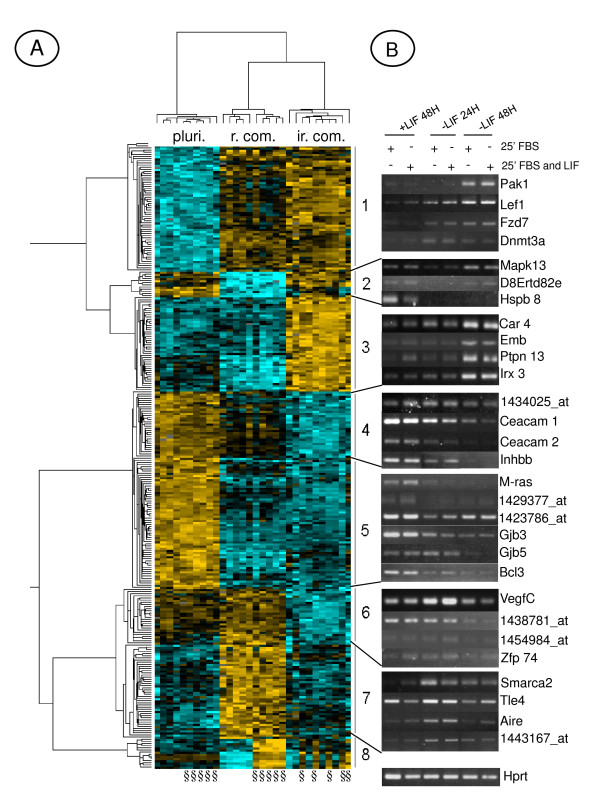
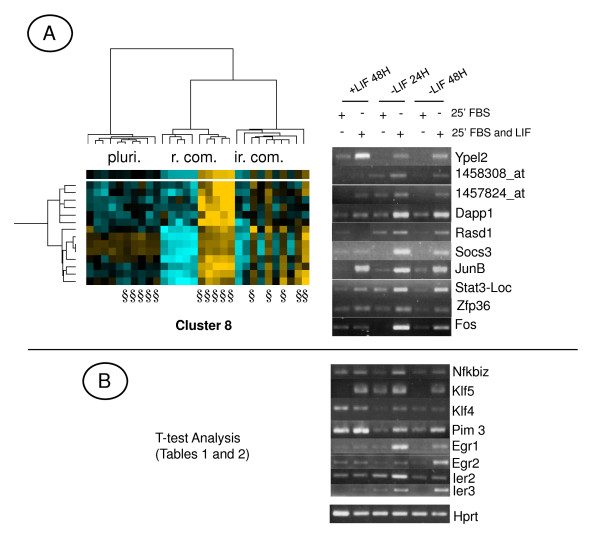
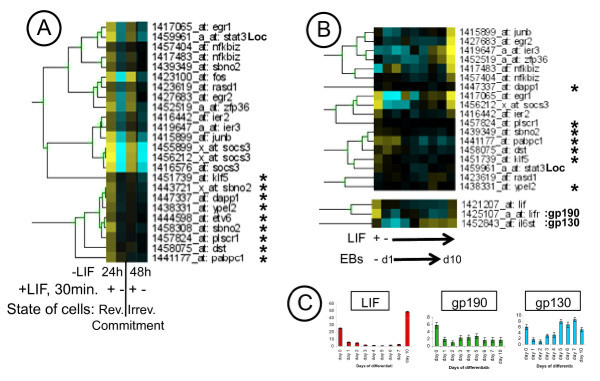
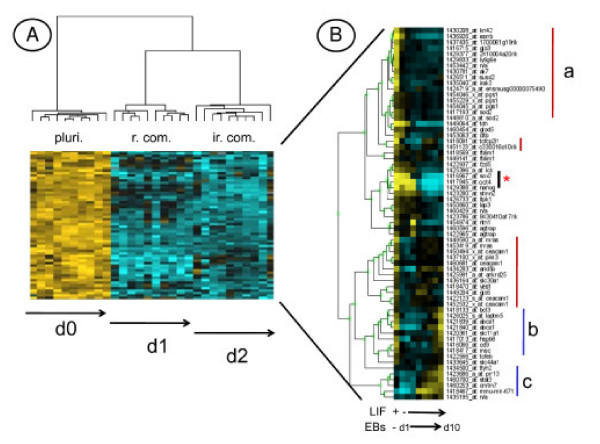
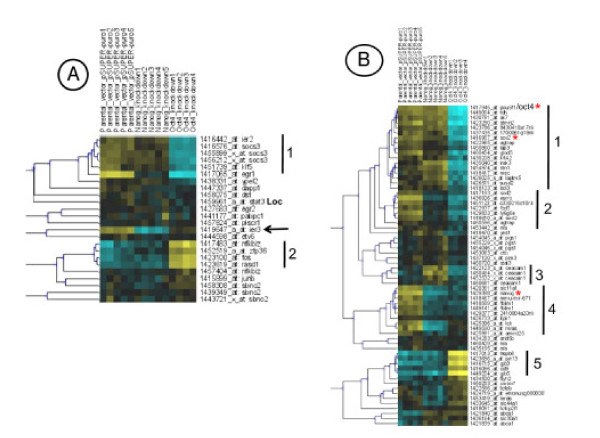
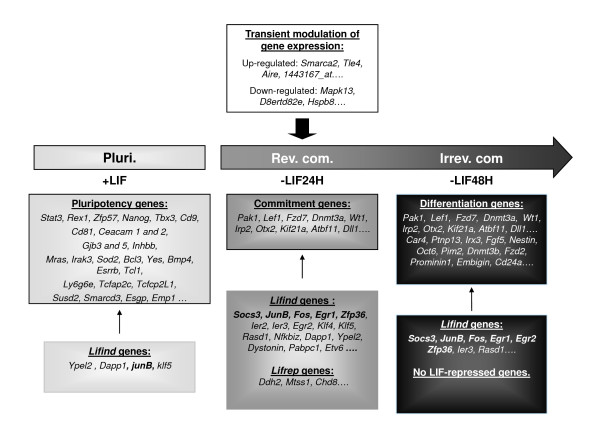
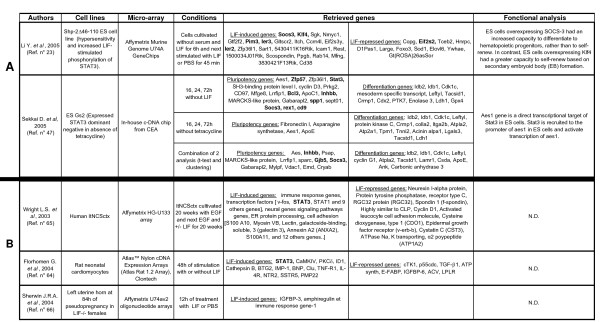
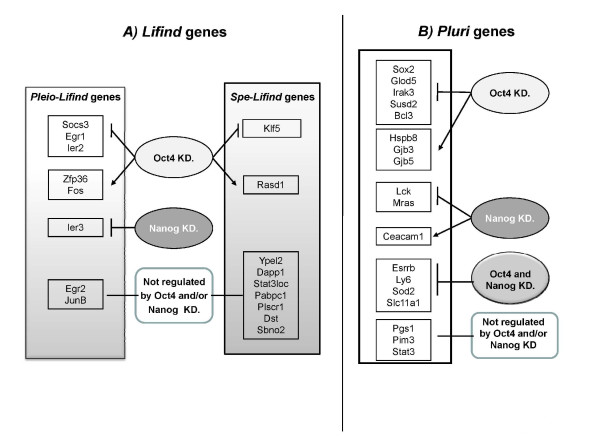
Results: By gene profiling studies carried out with mRNAs from ES cells and their early derivatives treated or not with LIF, we have identified i) LIF-dependent genes, highly expressed in pluripotent cells, whose expression level decreases sharply upon LIF withdrawal [Pluri genes], ii) LIF induced genes [Lifind genes] whose expression is differentially regulated depending upon cell context and iii) genes specific to the reversible or irreversible committed states. In addition, by hierarchical gene clustering, we have identified, among eight independent gene clusters, two atypical groups of genes, whose expression level was highly modulated in committed cells only. Computer based analyses led to the characterization of different sub-types of Pluri and Lifind genes, and revealed their differential modulation by Oct4 or Nanog master genes. Individual knock down of a selection of Pluri and Lifind genes leads to weak changes in the expression of early differentiation markers, in cell growth conditions in which these master genes are still expressed.

Conclusion: We have identified different sets of LIF-regulated genes depending upon the cell state (reversible or irreversible commitment), which allowed us to present a novel global view of LIF responses. We are also reporting on the identification of genes whose expression is strictly regulated during the commitment step. Furthermore, our studies identify sub-networks of genes with a restricted expression in pluripotent ES cells, whose down regulation occurs while the master knot (composed of OCT4, SOX2 and NANOG) is still expressed and which might be down-regulated together for driving cells towards differentiation.


Figures

Figure 1
Figure 1
The experimental strategy. A1) Western blot analyses showing STAT3 and P-STAT3 and A2) band shift analyses of specific LIF-dependent complexes in ES cells depleted of LIF for 24 h and reinduced with LIF for 10 to 120 min. or in pluripotent cells (+ LIF) as indicated. LIF specific complexe containing STAT3 (arrow) and non specific complexe (asterisk) are indicated. B) Diagram summarising the cell growth conditions used for microarray experiments: Mouse ES cells, in the pluripotent state (grown with LIF for 48 h, Pluri.) or induced to differentiate by LIF withdrawal for 24 h [reversible commitment (Rev.)] or 48 h [irreversible commitment (Irrev.)], have been treated for 25 min. with 10% FBS or 10% FBS and 500 pM LIF (+), as indicated, before harvesting. Sample numbers correspond to the conditions compared in Tables 1 to 7 (see Additional file 1). C) Quality controls of LIF response: Protein RIPA cell extracts from ES cells grown with LIF for 48 h or without LIF for 24 or 48 h and not treated (-) or treated for 25 min with FBS or FBS and LIF as in B). Western blot analysis were performed with antibodies reacting against all forms of STAT3 (STAT3), the activated STAT3 (P-STAT3 Tyr705) or with OCT4 and ERK2. D) Semi-quantitative RT-PCR performed with total RNAs from ES cells grown as indicated in B), have been performed with primers corresponding to the indicated genes.
Figure 2
Figure 2
Summary of pair-wise comparisons. A) LIF-induced (Lifind) or repressed (Lifrep) genes, in pluripotent cells (samples 1 and 2) or after 24 h (samples 3 and 4) or 48 h (samples 5 and 6) of LIF withdrawal, B) Pluri. genes and C) Markers from reversibly and irreversibly committed cells, were retrieved by pair-wise comparisons after a student t-test analysis with the p-value and fold change cut off as indicated for each Table, see Additional file 1. Each thick line indicated the condition for which the number of genes has been filtered, after t-test analysis, versus the other condition. Pluri: Pluripotent; Rev.com.: Reversible commitment; Irrev. com.: Irreversible commitment.
Figure 3
Figure 3
Identification of eight independent gene clusters. A) Each probe set is represented by a single row of colored boxes and single column represents each microarray. Cells with increasing up regulation colored with yellow of increasing intensity and increasing downregulation is colored with blues of increasing intensity. The similarity trees on the top (pluri.: Pluripotent; r. com.: reversible commitment; ir. com.: irreversible commitment) and on the left side, represent the similarity matrix of probe sets or microarrays. §: Samples treated 25 min. with FBS and LIF. B) Semi-quantitative RT-PCR of a selection of genes from clusters 1 to 7. Representative results, from 4 independent experiments, are shown.
Figure 4
Figure 4
Highlights on Cluster 8. A) Tree view representation of Lifind genes, regulated similarly by LIF in r. com. (reversible commitment) and ir. com. (irreversible commitment) conditions and validation of a selection of genes by semi-quantitative RT-PCR, B) Validation of a selection of Lifind genes retrieved by the t-test analysis. §: Samples treated 25 min. with FBS and LIF. Representative results, from 4 independent experiments, are shown.
Figure 5
Figure 5
In silico analyses of Lifind genes in various microarray experiments. Tree view representation of Heatmapper analyses of Lifind genes retrieved from Table 1 and analysed with Affymetrix data from reversibly (rev.) and irreversibly (irrev.) committed cell populations A), and in a kinetic of LIF withdrawal [day 1 (d1) to day 10 (d10) in EBs], B). The validation of the expression of LIF cytokine and of its composite receptor (gp130 and gp190), performed by RT-qPCR on three independent experiments, is shown as histograms with standard deviations in C). The asterisks point to genes not reinduced by LIF in differentiated cells (d10 EBs).
Figure 6
Figure 6
In silico analysis of Pluri genes. Heatmapper analysis of genes from Cluster 5 (as defined in Figure 3 and represented here in panel A) has been performed with Affymetrix data taken from the kinetic of LIF withdrawal (d1 to d10 of EBs differentiation), B). Relevant clusters are highlighted by red (a) or blue lines (b and c). The asterisks point to three master genes, sox2, oct4 and nanog manually included in this analysis.
Figure 7
Figure 7
In silico analysis of Lifind and Pluri genes: Regulation by OCT4 or NANOG. Heatmapper analyses performed respectively with LifindA) and PluriB) genes whose level of expression was analysed in microarray experiments taken from Loh et al, [19]. Relevant clusters are marked with black lines and numbered. Color code is like in Figure 3. yellow: expression above the median; black: median expression; blue: expression below the median.
Figure 8
Figure 8
Highlights of microarray analyses performed in pluripotent, reversibly and irreversibly ES-derived committed cells, treated or not with LIF. A selection of genes regulated in each cell state is presented. Bolded genes are the pleio-Lifind genes, identified in the ES cell system or in other LIF sensitive cell types.
Figure 9
Figure 9
A) Compilation of a selection of microarray data and comparison with our results. Microarray experiments have been compared with our analysis. Genes in common with those identified in our analysis are bolded. B) Comparison of Lifind genes in ES cells and other cell types and organ. This table is a compilation of results obtained in various LIF-responsive cell types (cardiomyocytes and neurons) and organ (uterus).
Figure 10
Figure 10
Lifind and Pluri gene expression in ES cells in which the expression of Oct4 or Nanog has been knocked-down. Summary of Pleio- and Spe-Lifind gene regulation A), and of Pluri gene regulation B), by Oct4 and/or Nanog, based on the heatmapper analysis.

Similar articles

Cited by

References

    1. Bradley A, Zheng B, Liu P. Thirteen years of manipulating the mouse genome: a personal history. Int J Dev Biol. 1998;42:943–950. - PubMed
    1. Smith AG. Embryo-derived stem cells: Of Mice and Men. Annu Rev Cell Dev Biol. 2001;17:435–462. doi: 10.1146/annurev.cellbio.17.1.435. - DOI - PubMed
    1. Wobus AM, Boheler KR. Embryonic stem cells: prospects for developmental biology and cell therapy. Physiol Rev. 2005;85:635–678. doi: 10.1152/physrev.00054.2003. - DOI - PubMed
    1. Boiani M, Scholer HR. Regulatory networks in embryo-derived pluripotent stem cells. Nat Rev Mol Cell Biol. 2005;6:872–884. doi: 10.1038/nrm1744. - DOI - PubMed
    1. Niwa H. How is pluripotency determined and maintained? Development. 2007;134:635–646. doi: 10.1242/dev.02787. - DOI - PubMed

Publication types

MeSH terms