

The contribution of malglycemia to mortality among allogeneic hematopoietic cell transplant recipients
- PMID: 19203725
- PMCID: PMC3181426
- DOI: 10.1016/j.bbmt.2008.12.488
The contribution of malglycemia to mortality among allogeneic hematopoietic cell transplant recipients
Abstract
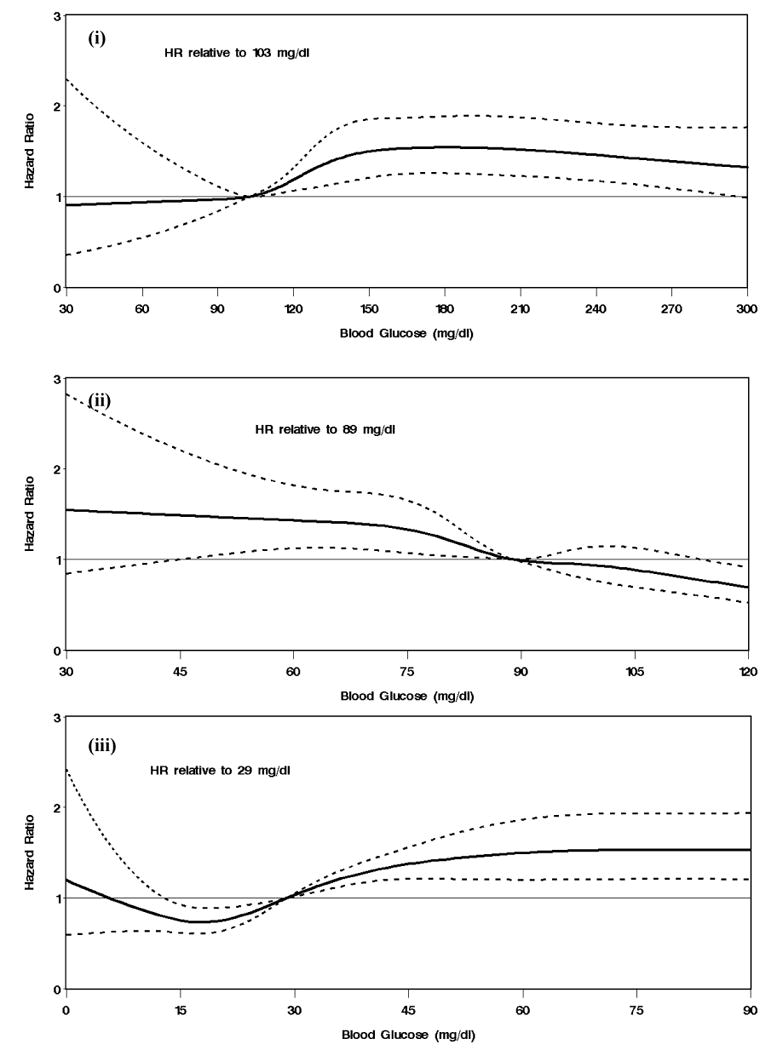
Allogeneic hematopoietic cell transplantation (HCT) continues to be associated with substantial rates of nonrelapse mortality (NRM). Numerous factors influence glucose metabolism among HCT recipients. We hypothesized that "malglycemia," defined as hyperglycemia, hypoglycemia or increased glycemic variability, is associated with increased mortality in HCT patients. In a retrospective cohort study Cox regression was used to assess the association of malglycemia after transplant with day 200 NRM. A total of 66,062 blood glucose (BG) measurements from 1175 adult allogeneic HCT recipients between 2000 and 2005 at the Fred Hutchinson Cancer Research Center were evaluated (median 0.55 values per patient-day, range: 0.09-3.62). Overall, there were 215 cases of NRM by day 200 post-HCT and 601 deaths from any cause throughout observation. After adjustment for previously identified factors associated with NRM, all 3 components of malglycemia were associated with increased NRM when individually modeled as time-dependent covariates. Specifically, the hazard ratio for death was 1.93 for BG >200 mg/dL (P = .0009) and 2.78 for BG >300 (P = .0004) compared with BG 101-150 mg/dL. A minimum BG </=89 was associated with a risk of day 200 NRM 2.17 times that of a minimum BG >89 (P < .0001). The upper quartile of glucose variability was associated with a 14.57-fold increase in risk of NRM by day 200 relative to the first quartile (P < .0001). These retrospective data indicate that malglycemia is associated with mortality following HCT. The applicability of these findings to other situations and whether correcting malglycemia in HCT can lead to reductions in mortality remain to be determined.
Figures


Comment in
-
Difficulties in monitoring the glucose status of patients undergoing hematopoietic stem cell transplantation.Biol Blood Marrow Transplant. 2009 Aug;15(8):1000. doi: 10.1016/j.bbmt.2009.05.002. Biol Blood Marrow Transplant. 2009. PMID: 19589491 Clinical Trial. No abstract available.
Similar articles
-
Malglycemia is associated with poor outcomes in pediatric and adolescent hematopoietic stem cell transplant patients.Blood Adv. 2019 Feb 12;3(3):350-359. doi: 10.1182/bloodadvances.2018021014. Blood Adv. 2019. PMID: 30718242 Free PMC article.
-
Glycemic Status and Infection Risk in Nondiabetic Autologous Hematopoietic Cell Transplantation Recipients.Biol Res Nurs. 2016 May;18(3):344-50. doi: 10.1177/1099800415619227. Epub 2016 Jan 19. Biol Res Nurs. 2016. PMID: 26792914 Free PMC article.
-
Blood glucose control using a computer-guided glucose management system in allogeneic hematopoietic cell transplant recipients.Bone Marrow Transplant. 2016 Jul;51(7):973-9. doi: 10.1038/bmt.2016.78. Epub 2016 Apr 4. Bone Marrow Transplant. 2016. PMID: 27042836
-
Pretransplantation Plasma ST2 Level as a Prognostic Biomarker of 1-Year Nonrelapse Mortality in Allogeneic Hematopoietic Cell Transplantation.Transplant Cell Ther. 2023 Feb;29(2):97.e1-97.e6. doi: 10.1016/j.jtct.2022.11.009. Epub 2022 Nov 11. Transplant Cell Ther. 2023. PMID: 36375798
-
Impact of donor and recipient Epstein-Barr Virus serostatus on outcomes of allogeneic hematopoietic cell transplantation: a systematic review and meta-analysis.Ann Hematol. 2021 Mar;100(3):763-777. doi: 10.1007/s00277-021-04428-9. Epub 2021 Jan 25. Ann Hematol. 2021. PMID: 33491135 Free PMC article.
Cited by
-
Hyperglycemia, symptoms, and symptom clusters in colorectal cancer survivors with type 2 diabetes.Support Care Cancer. 2022 Dec;30(12):10149-10157. doi: 10.1007/s00520-022-07442-3. Epub 2022 Nov 14. Support Care Cancer. 2022. PMID: 36376764
-
Efficacy of Umbilical Cord-Derived Mesenchymal Stem Cells in the Treatment of Type 2 Diabetes Assessed by Retrospective Continuous Glucose Monitoring.Stem Cells Transl Med. 2023 Dec 18;12(12):775-782. doi: 10.1093/stcltm/szad060. Stem Cells Transl Med. 2023. PMID: 37738447 Free PMC article. Clinical Trial.
-
New-Onset Post-Transplant Diabetes Mellitus after Allogeneic Hematopoietic Cell Transplant Is Initiated by Insulin Resistance, Not Immunosuppressive Medications.Biol Blood Marrow Transplant. 2019 Jun;25(6):1225-1231. doi: 10.1016/j.bbmt.2019.02.001. Epub 2019 Feb 7. Biol Blood Marrow Transplant. 2019. PMID: 30738170 Free PMC article.
-
A surgical nursing perspective analysis of glucose variability in BCLC stage B-C hepatocellular carcinoma patients with and without T2D within 1 year of hepatectomy: a retrospective cohort study from 2016 to 2020.J Gastrointest Oncol. 2023 Apr 29;14(2):943-951. doi: 10.21037/jgo-23-163. J Gastrointest Oncol. 2023. PMID: 37201059 Free PMC article.
-
Hyperglycemia in patients with hematologic malignancies.Curr Diab Rep. 2015 Mar;15(3):8. doi: 10.1007/s11892-015-0581-x. Curr Diab Rep. 2015. PMID: 25644817 Review.
References
-
- Preiser JC, Devos P. Clinical experience with tight glucose control by intensive insulin therapy. Crit Care Med. 2007;35:S503–507. - PubMed
-
- van den Berghe G, Wouters P, Weekers F, et al. Bouillon R Intensive insulin therapy in the critically ill patients. N Engl J Med. 2001;345:1359–1367. - PubMed
-
- Vanhorebeek I, Langouche L, Van den Berghe G. Tight blood glucose control with insulin in the ICU: facts and controversies. Chest. 2007;132:268–278. - PubMed
-
- Krinsley JS, Grover A. Severe hypoglycemia in critically ill patients: risk factors and outcomes. Crit Care Med. 2007;35:2262–2267. - PubMed
-
- Van den Berghe G, Wilmer A, Hermans G, et al. Intensive insulin therapy in the medical ICU. N Engl J Med. 2006;354:449–461. - PubMed
Publication types
MeSH terms
Substances
Grants and funding
LinkOut - more resources
Full Text Sources
Medical
