. 2009 May;26(5):1093-102.
doi: 10.1093/molbev/msp022. Epub 2009 Feb 9.

Founders, drift, and infidelity: the relationship between Y chromosome diversity and patrilineal surnames

Affiliations

Founders, drift, and infidelity: the relationship between Y chromosome diversity and patrilineal surnames

Turi E King et al. Mol Biol Evol. 2009 May.

Abstract

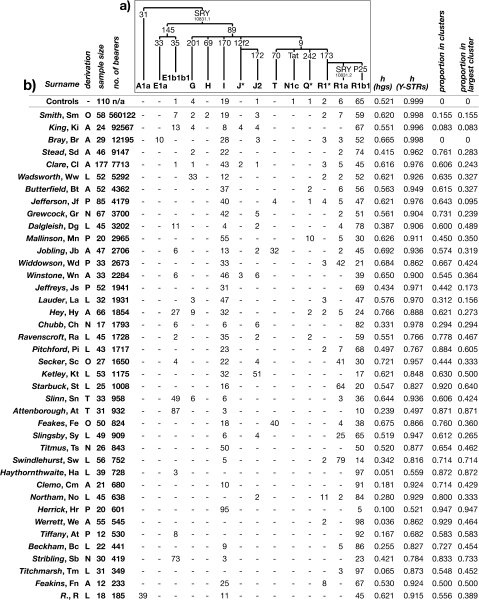
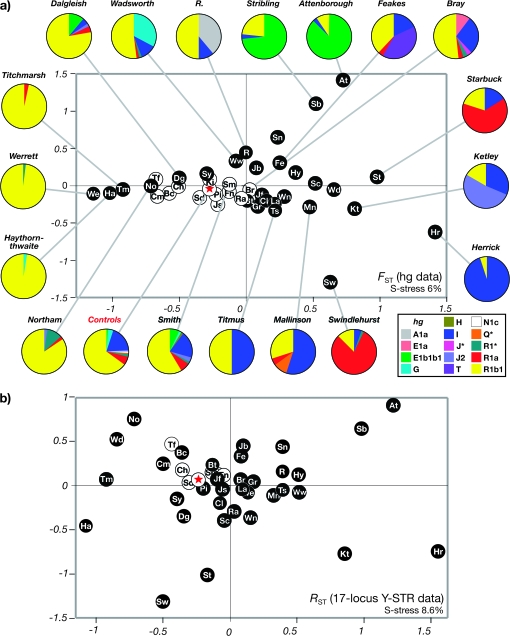
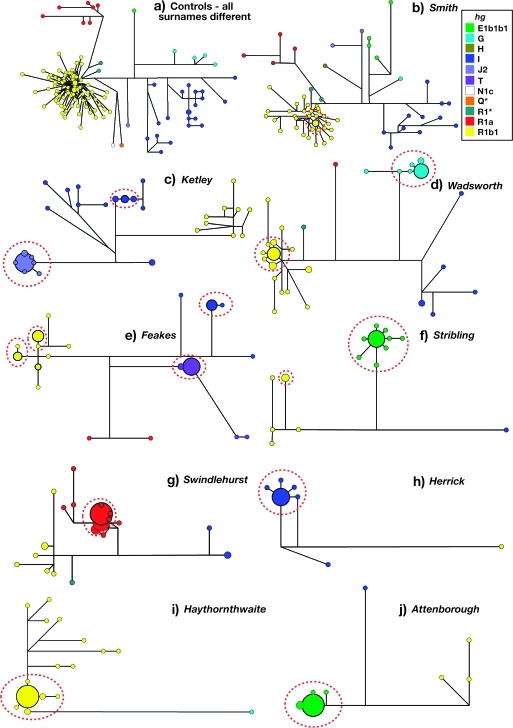
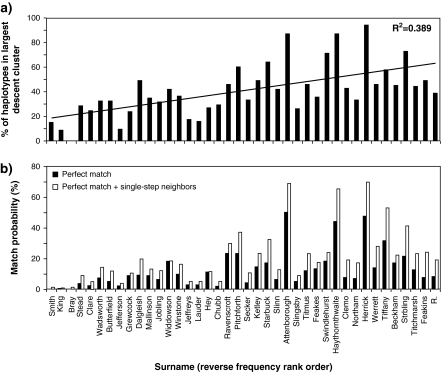
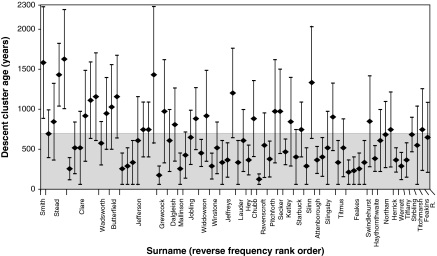
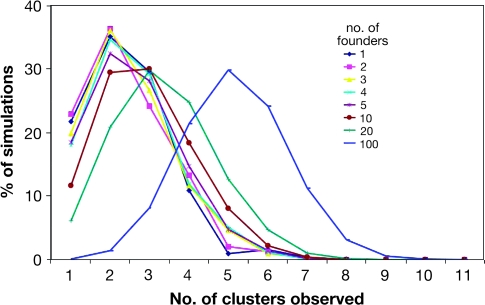
Most heritable surnames, like Y chromosomes, are passed from father to son. These unique cultural markers of coancestry might therefore have a genetic correlate in shared Y chromosome types among men sharing surnames, although the link could be affected by mutation, multiple foundation for names, nonpaternity, and genetic drift. Here, we demonstrate through an analysis of 1,678 Y-chromosomal haplotypes within 40 British surnames a remarkably high degree of coancestry that generally increases as surnames become rarer. On average, the proportion of haplotypes lying within descent clusters is 62% but ranges from 0% to 87%. The shallow time depth of many descent clusters within names, the lack of a detectable effect of surname derivation on diversity, and simulations of surname descent suggest that genetic drift through variation in reproductive success is important in structuring haplotype diversity. Modern patterns therefore provide little reliable information about the original founders of surnames some 700 years ago. A comparative analysis of published data on Y diversity within Irish surnames demonstrates a relative lack of surname frequency dependence of coancestry, a difference probably mediated through distinct Irish and British demographic histories including even more marked genetic drift in Ireland.


Figures

F<sc>IG</sc>. 1.—
FIG. 1.—
Haplogroup frequencies and gene diversities in 40 surnames and controls. (a) Tree showing phylogenetic relationships between haplogroups observed in this study, with mutation names given on branches. Unobserved haplogroups and associated markers are not shown, and shorthand names for haplogroups are explained in Materials and Methods. (b) Haplogroup frequencies, diversities, and summary of descent cluster findings. Each surname is followed by its abbreviation. Surname derivations are coded as follows—A: ambiguous/unknown; L: locative; N: nickname; O: occupational; P: patronymic/matronymic; and T: topographic. The total number of bearers of each surname in 1996 is given as the sum of bearers of all analyzed spelling variants—see supplementary table, Supplementary Material online. h: gene diversity. The number of clusters observed per surname is not shown, because this is sample-size dependent.
F<sc>IG</sc>. 2.—
FIG. 2.—
Relationships among 40 different surnames represented by MDS. (a) MDS analysis of 40 surnames (represented by abbreviations as shown in fig. 1) and controls (red star), based on pairwise FST calculated from haplogroup frequencies. White circle symbols indicate surnames not significantly different (P ≥ 0.05) from controls. Around the MDS plot are pie charts for selected surnames and controls, indicating haplogroup frequencies by sector areas colored according to the key below right. (b) MDS analysis of 40 surnames (represented by abbreviations as shown in fig. 1) and controls (red star), based on pairwise RST calculated from Y-STR haplotype frequencies. White circle symbols indicate surnames not significantly different (P ≥ 0.05) from controls.
F<sc>IG</sc>. 3.—
FIG. 3.—
Selected median-joining networks showing haplogroup and Y-STR haplotype diversity within controls and surname samples. Circles represent haplotypes, with areas proportional to frequency and colored according to haplogroup as shown in the key, top right. Lines between circles represent Y-STR or binary-marker mutational steps, with the shortest line in each network representing a single step. Boundaries of descent clusters are shown by the dotted ellipses.
F<sc>IG</sc>. 4.—
FIG. 4.—
Proportions of haplotypes in largest descent cluster and match probabilities. (a) Percentage of haplotypes lying in the largest descent cluster, with surnames ordered by reverse frequency rank. (b) Match probabilities for perfectly matching haplotypes, and matches including single-step mutational neighbors, with surnames ordered by reverse frequency rank.
F<sc>IG</sc>. 5.—
FIG. 5.—
Estimated ages of 74 descent clusters. Diamonds indicate estimates of TMRCA from the rho statistic within Network, and bars indicate standard deviations. The gray shaded area indicates the time since surname establishment (700 years). Surnames are ordered by frequency rank; note that some surnames contain more than one descent cluster that can be dated, whereas four (King, Bray, “Clemo,” and Beckham) contain none.
F<sc>IG</sc>. 6.—
FIG. 6.—
Numbers of observed descent clusters given different founder numbers in simulated data. Ten thousand simulations were carried out for each founder number; most give no descendants. Percentages here are based on at least 100 simulations in each of which at least 100 descendants survive.

Similar articles

Cited by

References

    1. Adams SM, King TE, Bosch E, Jobling MA. The case of the unreliable SNP: recurrent back-mutation of Y-chromosomal marker P25 through gene conversion. Forensic Sci Int. 2006;159:14–20. - PubMed
    1. Bandelt H-J, Forster P, Röhl A. Median-joining networks for inferring intraspecific phylogenies. Mol Biol Evol. 1999;16:37–48. - PubMed
    1. Bedoya G, Montoya P, Garcia J, et al. (11 co-authors) Admixture dynamics in Hispanics: a shift in the nuclear genetic ancestry of a South American population isolate. Proc Natl Acad Sci USA. 2006;103:7234–7239. - PMC - PubMed
    1. Bosch E, Calafell F, González-Neira A, et al. Male and female lineages in the Balkans show a homogeneous landscape over linguistic barriers, except for the isolated Aromuns. Ann Hum Genet. 2006;70:459–487. - PubMed
    1. Bosch E, Lee AC, Calafell F, Arroyo E, Henneman P, de Knijff P, Jobling MA. High resolution Y chromosome typing: 19 STRs amplified in three multiplex reactions. Forensic Sci Int. 2002;125:42–51. - PubMed

Publication types