. 2009 Apr 1;587(Pt 7):1461-79.
doi: 10.1113/jphysiol.2009.169409. Epub 2009 Feb 9.

Activation of neurokinin 3 receptor increases Na(v)1.9 current in enteric neurons

Affiliations

Activation of neurokinin 3 receptor increases Na(v)1.9 current in enteric neurons

Carine Copel et al. J Physiol. .

Abstract

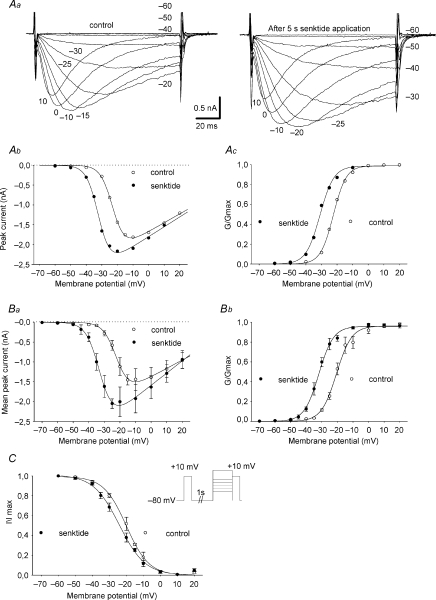
The intrinsic primary afferent neurons (IPANs) of the guinea pig enteric nervous system express Na(v)1.9 sodium channels that produce a persistent TTX-resistant current having a low activation threshold and slow gating kinetics. These neurons receive slow EPSPs induced mainly by the activation of neurokinin 3 receptors (NK3r). Here, we demonstrate that senktide, a specific NK3r agonist, potentiates the Na(v)1.9 current (I(Nav1.9)) in IPANs. Using whole-cell patch-clamp recordings from IPANs in duodenum longitudinal muscle/myenteric plexus preparations, we show that short (1-5 s) and long (up to 1 min) applications of senktide, increase the I(Nav1.9) peak current up to 13-fold. The effect, blocked by a NK3r antagonist SB235375 is transient, lasting approximately 2 min and is due to a negative shift of the activation voltage by approximately 20 mV and of fast inactivation by approximately 10 mV. As a consequence, the window current resulting from the product of the activation and fast inactivation curves is shifted and enlarged. The transient effect of senktide is likely to be due to the fast desensitization of NK3r. Protein kinase C (PKC) activation with phorbol or oleoyl acetylglycerol also increases I(Nav1.9), although persistently, by inducing similar voltage-dependent changes. Current-clamp experiments showed that I(Nav1.9) modulation by senktide lowers action potential threshold and increases excitability. The increase in I(Nav1.9) by NK3r activation is also likely to amplify slow EPSPs generated in the IPANs. These changes in excitability potentially have a profound effect on the entire enteric synaptic circuit and ultimately on gut motility and secretion.


Figures

Figure 1
Figure 1. Increase of the Nav1.9 current by activating NK3r. Recordings were made from enteric IPANs using whole-cell patch-clamp electrodes
A: family of Nav1.9 current traces in control conditions. Nav1.9 currents were isolated by including TTX (300 nm) in the extracellular solution and were evoked by stepping from −60 to +20 mV in 5 or 10 mV increments from a holding potential of −80 mV. Ba and b: mean peak current (n= 8; a) and normalized conductance (G/Gmax; b) obtained in control conditions and plotted versus membrane potential. In Bb, G/Gmax was fitted by a single Boltzmann function giving V1/2=−19.1 ± 1.3 mV and a slope factor p= 4.4 ± 0.4 mV. Ca and b: transient increase of Nav1.9 current induced by a 5 s application of senktide (4 μm). Ca: Nav1.9 currents evoked successively by depolarizing steps to −30 mV from −80 mV applied every 5 s. Cb: superimposed Nav1.9 current traces evoked before (1) and after (2 and 3) a 5 s senktide application at the times indicated in Ca. D: Nav1.9 currents evoked by depolarizing steps to −30 mV from a holding potential of −80 mV. Normalized peak Nav1.9 currents, obtained as in Ca, were plotted against time, with T= 0 referring to the beginning of the 5 s senktide application (n= 4). Ea and b: selective involvement of NK3r in Nav1.9 current increase. Ea: mean normalized Nav1.9 peak currents evoked by depolarizing steps to −20 from −80 mV applied every 5 s, before and after 5 s senktide applications, in the continued presence of the NK3r antagonist SB235375 (1 μm; n= 8). Eb: histogram showing the percentage of current increase in response to 5 s applications of senktide in the absence (n= 4) or presence of SB235375 (n= 8). Mann–Whitney test: P= 0.004. Fa and b: transient increase of Nav1.9 current induced by a 5 s application of substance P (1 μm). Fa: Nav1.9 currents evoked successively by depolarizing steps to −10 mV from −80 mV applied every 5 s. Fb: superimposed Nav1.9 current traces evoked before (1) and after (2) the substance P application at the times indicated in Fa.
Figure 2
Figure 2. Time course of NK3r-mediated increase in Nav1.9 current
Aa and b: the duration of the senktide application did not influence the time course of decline in the NK3r-mediated effect on Nav1.9 current. Aa: normalized Nav1.9 currents evoked by depolarizing steps to −30 mV from a holding potential of −80 mV and recorded when senktide was applied for 1 s (n= 7), 15 s (n= 6), 30 s (n= 4) and 60 s (n= 5). Average time constants, τ, of the decay of the senktide effects, determined by monoexponential fits, ranged from 16.9 to 29.2 s. Ab: absence of correlation between the time constants of the decay of the senktide effects and the durations of senktide applications. B: desensitization of the responses to senktide in neurons exposed to 2 successive applications of senktide (1 s, St1 and St2) separated by a 5 min interval. Inset: histogram showing the mean increase induced by St1 and St2 in Nav1.9 currents evoked by depolarizing steps to −30 mV from a holding potential of −80 mV (mean peak INav1.9 in response to St1: from 0.2 ± 0.10 to 2.2 ± 0.6 nA; mean peak INav1.9 in response to St2: from 0.2 ± 0.06 to 0.8 ± 0.3 nA; n= 6; Wilcoxon test: P= 0.0313).
Figure 3
Figure 3. Voltage dependence of the change in Nav1.9 current by NK3r activation
Aac: effect of hyperpolarizing the holding potential on senktide responses. Aa: histogram showing that the peak amplitude of the Nav1.9 current reached after NK3r activation is not significantly affected by changing the holding potential (Kruskal–Wallis test : P= 0.06). Ab and Ac: normalized Nav1.9 currents evoked by depolarizing steps to −30 mV from a holding potential of either −60 mV (b; n= 7) or – 90 mV (c; n= 6). The time constants of the decay of the senktide effect, determined by fitting the decay period by a monoexponential function, increased significantly at −90 mV (Mann–Whitney test: P= 0.0023). Ba and b: the increase in the Nav1.9 current depends on the depolarizing step amplitude. Ba: Nav1.9 currents evoked at 5 s intervals by paired depolarizing steps to −30 mV (upper traces and inset) and 0 mV (lower traces and inset) from −80 mV. Insets: superimposed traces 1 and 2 obtained before and 15 s after 1 s senktide application. Bb: histogram comparing the percentage of peak current increase of Nav1.9 currents evoked by depolarizing steps to different potentials. Mann–Whitney test: −20 mV (n= 9)/+20 mV (n= 17): P= 0.0183; −30 mV (n= 24)/0 mV (n= 15): P < 0.0001; −30 mV (n= 24)/+20 mV (n= 17): P < 0.0001.
Figure 4
Figure 4. Changes in voltage-dependent properties of Nav1.9 current during the senktide effects
Aac: senktide negatively shifts the voltage dependence of Nav1.9 activation. Aa: families of Nav1.9 current traces obtained before (left panel) and after 5 s application (right panel) of senktide. Currents were evoked every 10 s by stepping from −60 to 10 mV from a holding potential of −80 mV. Nav1.9 current–voltage relationships (Ab) and corresponding activation curves (G/Gmax, Ac) determined from the traces shown in Aa. Ac: the data points are fitted with a Boltzmann function giving V1/2 values of −22.4 mV and −31 mV in the absence and presence of senktide, respectively. Ba and b: mean peak current (a) and normalized conductance (G/Gmax; b) plotted versus membrane potential, in the presence or absence of senktide. In Bb, V1/2control (−19.2 ± 1.7 mV) and V1/2senktide (−31 ± 0.8 mV) are significantly different (Wilcoxon test: P= 0.00156; n= 7). p was unchanged (pcontrol= 5.5 ± 0.9 mV and psenktide= 4.9 ± 0.7 mV). C: senktide negatively shifts the voltage dependence of Nav1.9 fast inactivation. Fast inactivation was evoked at +10 mV in response to 200 ms conditioning voltage steps as shown in the inset and normalized peak Nav1.9 currents were plotted against conditioning potentials. The data points were fitted with a Boltzmann function giving the following parameters: V1/2control=−20.6 ± 1.6 mV, p=−6.6 ± 0.5 mV; V1/2senktide=−24.4 ± 1.3 mV, p=−6.0 ± 0.4 mV (n= 6). V1/2control and V1/2senktide are significantly different (Wilcoxon test: P= 0.0313).
Figure 5
Figure 5. Persistent Nav1.9 current is transiently increased and negatively shifted by NK3r activation
Aa: whole-cell currents evoked by a slow voltage ramp (100 mV s−1) from −80 to 0 mV. The current traces have been recorded in control conditions (1), at the peak of the effects of a 5 s senktide application, and 100 s after the application of senktide (3) in normal Na+. Each sweep was separated by an 8 s interval in order to avoid cumulative inactivation. Note that the net inward current was strongly increased and negatively shifted by approximately 15 mV by senktide (arrow). Ab: difference currents obtained from the traces shown in Aa. The arrow shows the backward shift of the net inward current during the 95 s interval between traces 2 and 3. Ba and b: Nav1.9 currents recorded in an inverse transmembrane Na+ gradient. Ba: increase in outwardly flowing Nav1.9 current evoked at −20 mV by the application of senktide (holding potential =−80 mV). Bb: increase and negative shift of the net outward current induced by a slow voltage ramp (100 mV s−1) applied before (1) and 5 s after senktide application (2).
Figure 6
Figure 6. Probing the extent of the voltage-dependent shift at the peak of the senktide effect
Aad: current kinetics before and after senktide application: Aa: successive sweeps of Nav1.9 currents evoked by 100 ms test pulses to −20 mV applied every 5 s from a holding potential of −80 mV. Abd: superimposed Nav1.9 current traces recorded in control (1), and at the beginning (2) or at the end (3) of the senktide application as numbered in Aa. Activation (τact) and inactivation (τinact) kinetics were fitted by using monoexponential functions (thick continuous traces). Note the acceleration of the activation and inactivation kinetics at the peak of the senktide effect (τact= 8.5 ms for trace 1 and 5 ms for trace 2 in Ab; τinact= 80 ms for trace 1 and 34 ms for trace 2 in Ac). These accelerations were transient as shown in Ad. Ba and b: time course of the changes in τact (a) and τinact (b) induced by senktide. Data from A. Ca and b: summary showing activation (a) and fast inactivation (b) time constants over a range of membrane potentials in control conditions and at the peak of the senktide effect. The data obtained in control conditions were fitted to Gaussian functions (filled symbols). The control Gaussian fits were then translated towards the points obtained at the peak of the senktide effect (open symbols). This procedure allows the prediction of a shift of the voltage dependence of −20 and −8.5 mV for the activation and the fast inactivation, respectively. Each data point represents the mean ±s.e.m. of 6 experiments.
Figure 7
Figure 7. Simulated senktide effects on the Nav1.9 current
Aa: plots of the voltage dependence of activation and fast inactivation before (black continuous lines) and 5 s after (grey continuous lines) NK3r stimulation. The dotted lines represent the product of the two fitting functions corresponding to the predicted voltage dependence of the resulting window current. In order to calculate the voltage dependence of activation and inactivation, the same parameters as obtained from the data of Fig. 4 (for control values) and Fig. 6 (for senktide effect values) were used. Fitting parameters for activation were: V1/2control=−20 mV, p= 5.5 mV and V1/2senktide=−40 mV, p= 4.6 mV and for fast inactivation: V1/2control=−20 mV, p= 6.6 mV and V1/2senktide=−28.5 mV, p= 7 mV. Ab: experimentally observed effects of senktide. Plots of the voltage dependence of activation and fast inactivation before (black continuous lines) and after application of senktide (grey continuous lines). The dotted lines represent the voltage dependence of the window current with and without senktide (compare with Aa). Fitting parameters for activation were: V1/2control=−20 mV, p= 5.5 mV and V1/2senktide=−31 mV, p= 5 mV and for fast inactivation: V1/2control=−20 mV, p= 6.6 and V1/2senktide=−25 mV, p=−6 mV. Data derived from Fig. 4Bb and C. B: time course showing the increase in simulated Nav1.9 current induced by senktide as depicted in A. The currents were activated by depolarizing steps from −80 to −25 mV applied every 5 s. The imposed time constants for the leftward and backward shifts were 5 and 25 s, respectively. Inset: normalized Nav1.9 current traces obtained in control conditions (black trace, 1) and at the peak of the senktide effect (grey trace, 2).
Figure 8
Figure 8. Activation of PKC mimics the effects of senktide on the Nav1.9 current
Aa and b: families of Nav1.9 current traces evoked by stepping from −60 to 10 mV (a) or 20 mV (b) from a holding potential of −80 mV. Aa: control conditions. Ab: 3 min after bath application of PdBu (1 μm). B: time course of the effects of PdBu (1 μm). The Nav1.9 current was evoked by depolarizing steps to −20 from −80 mV applied every 5 s. The times at which recordings in A were taken are indicated by arrows. Cac: effect of PKC activators on the mean peak current (Ca, PdBu) and its activation (Cb, PdBu and Cc, OAG). In Cb and Cc, showing G/Gmax plotted versus membrane potential, the half-activation voltage V1/2 is more negative (V1/2PdBu: −29 ± 1.5 mV; n= 4; V1/2OAG: −23.6 ± 4.5 mV; n= 3) in the presence of PdBu or OAG than in control conditions (V1/2controlPdBU: −19 ± 1.3 mV; n= 4; V1/2controlOAG: −16.5 ± 5.5 mV; n= 3) whereas the slope factor remains unchanged (mean pPdBu= 4.2 ± 0.9; mean pcontrolPdBu= 4.9 ± 0.8; n= 4; mean pOAG= 4.8 ± 0.8; mean pcontrolOAG= 5 ± 1.2; n= 3). Da and b: effect of PdBu on the voltage dependence of the fast inactivation. Da: voltage dependence of inactivation of the Nav1.9 current evoked at +20 mV in response to 500 ms conditioning voltage steps at −30 and −50 mV in the presence and the absence of PdBu. Db: mean normalized Nav1.9 peak current plotted against the conditioning potential in the presence and the absence of PdBu (mean inactivation V1/2control=−19.2 ± 1.3 mV; mean inactivation V1/2PdBu=−28 ± 3 mV; mean pcontrol= 7.8 ± 0.9; mean pPdBu= 7.4 ± 2; n= 4).
Figure 9
Figure 9. NK3r-mediated increase of the Nav1.9 current triggers long-lasting plateau depolarization and facilitates spiking
Aa and b: recordings made using a CsCl-based pipette solution and TTX, CsCl and CdCl2 added to the bath. Representative current-clamp responses to 40 ms current pulses before (a) and after 10 s senktide application (b). Steady bias current (∼−75 pA) was injected to hold the neuron at −80 mV in both A and B. Injected current pulses were incremented in 20 pA steps. Note that current pulses elicited passive RC-circuit type responses and regenerative action potential-like responses in Aa whereas in Ab this regenerative response was followed by a long-lasting plateau depolarization. Ba and b: recordings made using a KCl-based pipette solution and TTX omitted from the bath. Membrane potential changes evoked by a series of current pulse injections before (a) and after senktide application (b). Note that senktide lowers the threshold of excitability and increases the number of action potentials in response to injected currents. The presence of Cd2+ in the bath prevented modulation of the slow after HyperPolarisation (sAHP) by senktide.
Figure 10
Figure 10. Facilitated spiking persisted when Nav1.9 modulation by NK3r was performed when TASK1 was blocked
A: INav1.9 is not affected by methanandamide, a selective TASK1 blocker. INav1.9, recorded in the standard ionic conditions, was evoked by depolarizing steps from −80 mV to −20 mV. Ctr, control trace; Meth, trace obtained 30 s after starting an application of methanandamide (10 μm). Ba and b: ramp currents induced by voltage ramps from −100 to 0 mV, when recording with KCl in the pipette and with an extracellular solution containing no TTX, TEA, 4-AP or CsCl2 but with CdCl2. Ba: in the presence of methanandamide a component of background current that presents TASK1-like characteristics was blocked. Bb: adding senktide revealed an inward current as a consequence of the amplification of INav1.9. Note that senktide also activated a Na+-induced K+ current. Ca and b: membrane potential changes evoked by a series of current pulse injections before (Ca) and after senktide application (Cb), using recording conditions as in Ba and Bb. Note that senktide lowers the threshold of excitability and increases the number of action potentials in response to injected currents. The presence of Cd2+ in the bath prevented modulation of the sAHP by senktide.

Comment in

Similar articles

Cited by

References

    1. Alex G, Kunze WA, Furness JB, Clerc N. Comparison of the effects of neurokinin-3 receptor blockade on two forms of slow synaptic transmission in myenteric AH neurons. Neuroscience. 2001;104:263–269. - PubMed
    1. Baker MD. Protein kinase C mediates up-regulation of tetrodotoxin-resistant, persistent Na+ current in rat and mouse sensory neurones. J Physiol. 2005;567:851–867. - PMC - PubMed
    1. Baker MD, Chandra SY, Ding Y, Waxman SG, Wood JN. GTP-induced tetrodotoxin-resistant Na+ current regulates excitability in mouse and rat small diameter sensory neurones. J Physiol. 2003;548:373–382. - PMC - PubMed
    1. Bertrand PP, Galligan JJ. Contribution of chloride conductance increase to slow EPSC and tachykinin current in guinea-pig myenteric neurones. J Physiol. 1994;481:47–60. - PMC - PubMed
    1. Bertrand PP, Galligan JJ. Signal-transduction pathways causing slow synaptic excitation in guinea pig myenteric AH neurons. Am J Physiol Gastrointest Liver Physiol. 1995;269:G710–720. - PubMed

MeSH terms