. 2009 Apr;29(8):2308-21.
doi: 10.1128/MCB.01841-08. Epub 2009 Feb 9.

Sub1 functions in osmoregulation and in transcription by both RNA polymerases II and III

Affiliations

Sub1 functions in osmoregulation and in transcription by both RNA polymerases II and III

Emanuel Rosonina et al. Mol Cell Biol. 2009 Apr.

Abstract

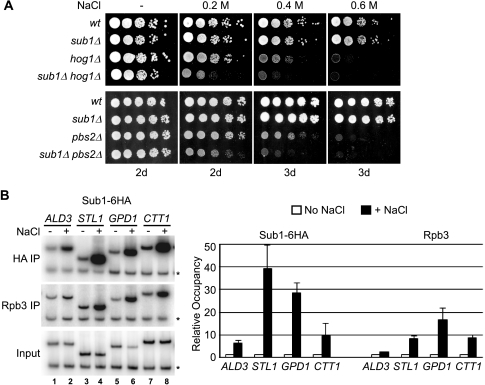
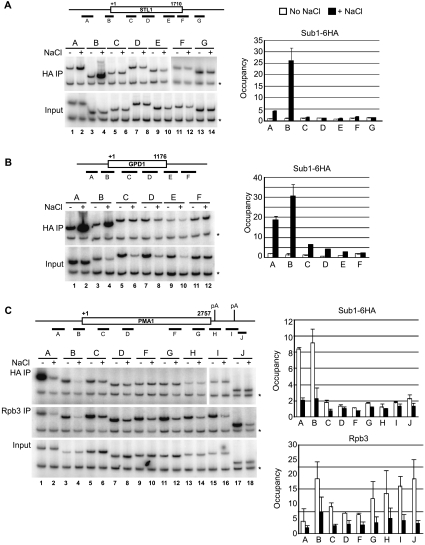
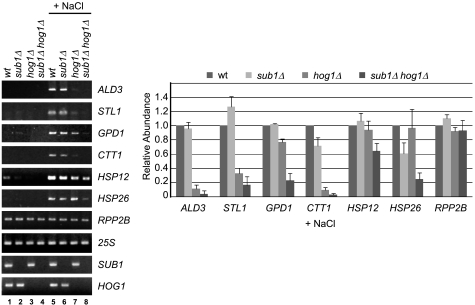
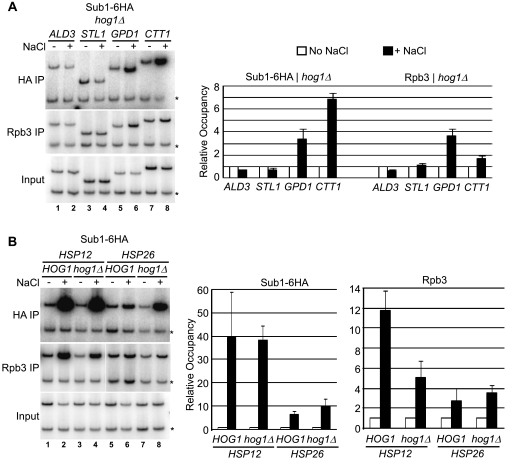
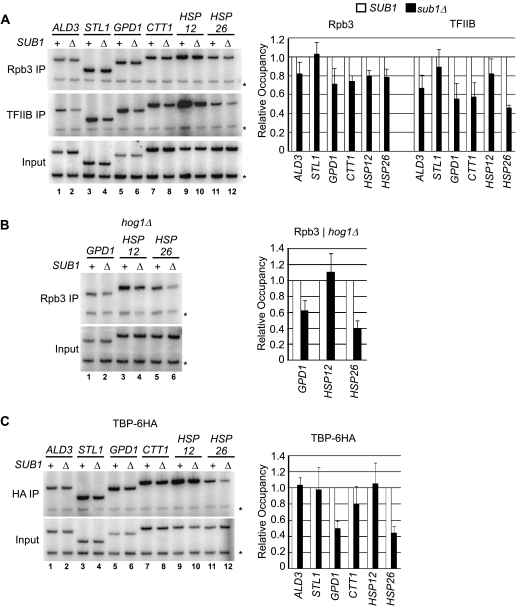
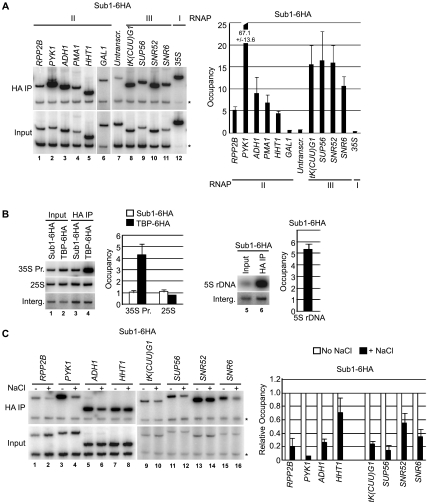
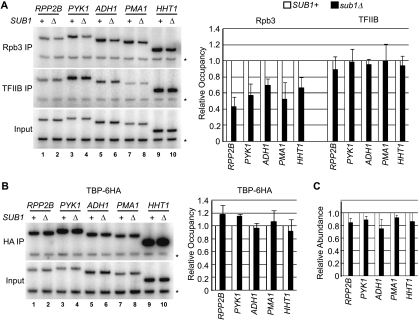
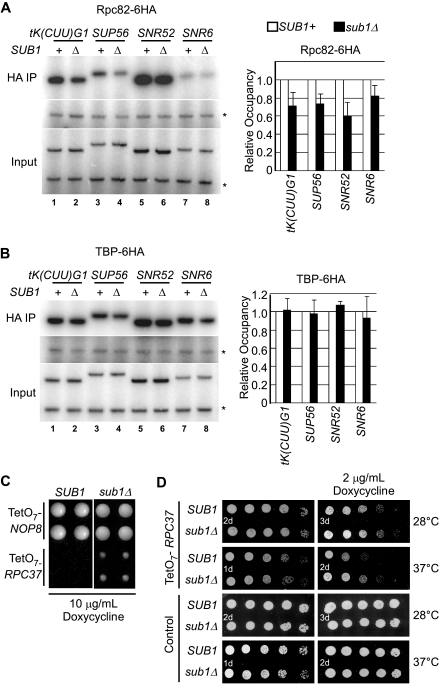
Sub1 is implicated in transcriptional activation, elongation, and mRNA 3'-end formation in budding yeast. To gain more insight into its function, we performed a synthetic genetic array screen with SUB1 that uncovered genetic interactions with genes involved in the high-osmolarity glycerol (HOG) osmoresponse pathway. We find that Sub1 and the HOG pathway are redundant for survival in moderate osmolarity. Chromatin immunoprecipitation analysis shows that Sub1 is recruited to osmoresponse gene promoters during osmotic shock and is required for full recruitment of TBP, TFIIB, and RNA polymerase II (RNAP II) at a subset of these genes. Furthermore, we detect Sub1 at the promoter of every constitutively transcribed RNAP II and, unexpectedly, at every RNAP III gene tested, but not at the RNAP I-transcribed ribosomal DNA promoter. Significantly, deletion of SUB1 reduced levels of promoter-associated RNAP II or III at these genes, but not TBP levels. Together these data suggest that, in addition to a general role in polymerase recruitment at constitutive RNAP II and RNAP III genes, during osmotic shock, Sub1 facilitates osmoresponse gene transcription by enhancing preinitiation complex formation.


Figures

FIG. 1.
FIG. 1.
Evidence that Sub1 plays a role in osmoregulation. (A) SUB1 interacts genetically with members of the HOG pathway during osmotic stress. Meiotic progeny from sporulation of sub1Δ/SUB1 hog1Δ/HOG1 and sub1Δ/SUB1 pbs2Δ/PBS2 double heterozygous diploids (strains ERYM314 and ERYM441, respectively) were isolated by tetrad dissection. Approximately equal numbers of cells (∼104) of the indicated genotypes were spotted in the first column, with fivefold serial dilutions in each subsequent column, on rich medium (-) or medium containing the indicated concentration of NaCl. Days of growth are indicated at the bottom. (B) Sub1 is targeted to osmoresponse gene promoters after exposure to osmotic stress. Cells expressing Sub1-6HA (strain ERYM318C) were exposed to 0.4 M NaCl (+) or mock treated (−) for 5 min. ChIP analysis was performed using an HA antibody (HA IP) or an antibody recognizing the Rpb3 subunit of RNAP II (Rbp3 IP), and DNA fragments were detected by PCR using primers for the indicated osmoresponse gene promoters. Control primers, recognizing sequences in an untranscribed region of chromosome V, were included in the PCRs (*), and input chromatin was also analyzed by PCR for comparison and quantification. Quantification, indicating occupancy of Sub1-6HA or Rpb3 in NaCl-treated cells relative to occupancy in mock-treated cells, was performed as described in Materials and Methods. Occupancy levels for mock-treated cells (no NaCl) are all normalized to 1 and are shown for comparison. Analysis of Sub1-6HA occupancy at nonstress, constitutively expressed genes is shown in Fig. 6C.
FIG. 2.
FIG. 2.
Sub1 associates predominantly with the promoters of transcribed genes. Detailed ChIP analysis of Sub1-6HA occupancy along the osmoresponse genes STL1 (A) and GPD1 (B) and the constitutively transcribed gene PMA1 (C) was performed. Analysis and quantification were performed as for Fig. 1B using the primer pairs indicated in the gene diagrams. (A and B) Sub1-6HA occupies STL1 and GPD1 genes only during osmotic stress, and Sub1-6HA occupancy is restricted to promoter-proximal regions (primer pair B for both genes), although significantly lower levels of Sub1-6HA are detected at coding regions of GPD1 (primer pairs C through E). (C) Consistent with previous studies that showed that PMA1 transcription is downregulated during the osmotic stress response (31), Rpb3 cross-linking was significantly reduced after exposure to NaCl (Rpb3 IP). Under nonstress conditions, Sub1-6HA was detected only at promoter-proximal regions of PMA1 (HA IP, primer pairs A and B). In NaCl-treated cells, promoter-associated Sub1-6HA cross-linking essentially disappeared (HA IP). *, control primers.
FIG. 3.
FIG. 3.
Sub1 contributes to the transcription of osmoresponse genes. Total RNA was isolated from the four yeast strains used in Fig. 1A (top), of the indicated genotypes, after exposure to NaCl (+ NaCl) or mock treatment. Levels of osmoresponse gene transcripts (as indicated) were determined by RT-PCR. In addition, transcript levels of the constitutively transcribed RPP2B gene and RNAP I-transcribed 25S rRNA in each sample were determined as a control. The deletion of SUB1 and HOG1 was confirmed by detection of their transcripts only in the appropriate samples. Semiquantitative analysis of relative abundance after NaCl exposure is at the right, with values for each gene set normalized to wt levels after correction for total RNA levels in each sample, as estimated by the 25S rRNA signal.
FIG. 4.
FIG. 4.
Hog1-independent recruitment of Sub1 to osmoresponse genes. (A) A strain with HOG1 deleted (hog1Δ) and expressing tagged Sub1 (Sub1-6HA, strain ERYM369) was exposed to osmotic shock (+ NaCl) or mock treated (no NaCl), and levels of Sub1-6HA and RNAP II occupancy (HA IP and Rpb3 IP, respectively) at the promoter regions of the indicated osmoresponse genes were determined and quantified as in Fig. 1B. (B) Occupancy of Sub1-6HA and RNAP II at the HSP12 and HSP26 genes in HOG1 and hog1Δ cells (strains ERYM318C and ERYM369, respectively) in mock-treated cells and in response to osmotic shock was determined and quantified as in Fig. 1B. *, control primers.
FIG. 5.
FIG. 5.
SUB1 deletion suppresses recruitment of RNAP II, TBP, and TFIIB at active osmoresponse genes. (A) SUB1+ and sub1Δ cells were treated with NaCl, and RNAP II and TFIIB occupancy at the promoters of the indicated osmoresponse genes was determined (Rpb3 IP and TFIIB IP, respectively). ChIP analysis and quantification (indicating occupancy of Rpb3 or TFIIB in sub1Δ cells relative to occupancy in wt cells) were performed as for Fig. 1B. (B) Three genes showing osmotic-shock-dependent transcription in the absence of Hog1 (Fig. 3) were analyzed for RNAP II occupancy (Rpb3 IP) in hog1Δ cells in the presence or absence of Sub1 (using strains derived from the experiment in Fig. 1A). Cells were exposed to NaCl and analyzed by ChIP as in Fig. 1B. (C) A strain expressing tagged TBP (TBP-6HA) was generated in SUB1+ and sub1Δ strain backgrounds (strains ERYM481D and ERYM542), and the effect of SUB1 deletion on TBP recruitment to the indicated osmoresponse genes was determined 5 minutes after the addition of NaCl by ChIP, as in Fig. 1B. *, control primers.
FIG. 6.
FIG. 6.
Sub1 is detected at both constitutively transcribed RNAP II and at RNAP III genes. (A) Occupancy of Sub1-6HA at the indicated constitutively transcribed genes was determined by ChIP as in Fig. 1B. RNAP II transcribes the highly transcribed PYK1, ADH1, and PMA1 genes; the ribosomal protein gene RPP2B; the histone H3 gene, HHT1; and the inducible GAL1 gene, which is repressed in the conditions used. RNAP III-transcribed genes that were tested include genes for tRNAs [tk(CUU)G1 and SUP56], a snoRNA (SNR52), and U6 snRNA (SNR6). The RNAP I-transcribed 35S rDNA promoter region was also examined (35S). Because the 35S sequence is highly repeated, we examined 10-fold less of the immunoprecipitated material by PCR for this gene. An untranscribed region of chromosome VII was used as a control (Untranscr.). *, control primers. (B) Occupancy of Sub1-6HA and TBP-6HA at the rDNA gene promoter region (35S Pr.) and internally at the 25S rRNA-encoding region (25S) was determined. The intergenic control region (Interg.) was analyzed in separate PCRs with 10-fold-more material than for the 35S promoter and 25S regions. As for panel A, quantification indicates change with respect to background (input), and therefore a value of 1 indicates no signal over background. Occupancy of Sub1-6HA at the 5S rDNA gene (RDN5-1), as shown at the right, was likewise determined. (C) Sub1 evacuates constitutively transcribed RNAP II and III genes in response to osmotic stress. Levels of Sub1-6HA occupation at the indicated RNAP II and III genes in mock-treated cells and in cells exposed to 0.4 M NaCl for 5 min were determined by ChIP, as in Fig. 1B. A similar osmotic-stress-dependent reduction in Sub1-6HA occupancy was detected at the PMA1 promoter (see Fig. 2C).
FIG. 7.
FIG. 7.
Sub1 affects RNAP II recruitment at constitutively transcribed genes without affecting TBP and TFIIB occupancy. Levels of RNAP II and TFIIB (A) and TBP (B) at the indicated constitutively transcribed RNAP II genes in SUB1+ and sub1Δ cells were measured. RNAP II (Rpb3 IP) and TFIIB ChIPs were performed using the same chromatin samples, whereas TBP was measured using chromatin from a strain expressing TBP-6HA, as in Fig. 5C. *, control primers. (C) Total RNA was isolated from SUB1+ and sub1Δ cells, and steady-state transcript levels were determined by RT-PCR. Semiquantitative analysis is shown, with values for the sub1Δ set normalized to corresponding wt levels after correction for total RNA levels in each sample, as estimated from the 25S rRNA signal.
FIG. 8.
FIG. 8.
Involvement of Sub1 in RNAP III transcription. (A) Levels of RNAP III association with the indicated genes in SUB1+ and sub1Δ cells expressing a tagged version of Rpc82 (Rpc82-6HA, strains ERYM573A and ERYM574A, respectively) were determined by ChIP. (B) Analysis of TBP levels associated with the indicated genes was performed as for Fig. 7B. To facilitate analysis, 10-fold-less immunoprecipitated material was analyzed by PCR in the HA immunoprecipitation set than for the corresponding intergenic set in panels A and B. *, control primers. (C) Colony size comparison for a strain in which the gene expressing the Rpc37 subunit of RNAP III (TetO7-RPC37) is under the control of a promoter repressed by tetracycline and an isogenic strain lacking SUB1, both grown on medium containing 10 μg/ml doxycycline for 48 h. Quadruplicate analysis is shown, and, for comparison, a similar analysis of the TetO7-NOP8 strain, in which the NOP8 gene (unrelated to RNAP III transcription) is under the control of the tetracycline-repressed promoter, was performed. (D) Spot analysis (as in Fig. 1A) of the TetO7-RPC37 SUB1 and sub1Δ strains on control medium and medium containing 2 μg/ml doxycycline at 28°C and 37°C. The same analysis was performed on wt cells, unaffected by growth in doxycycline, as a control. Days of growth are indicated on each photograph.

Similar articles

Cited by

References

    1. Albertyn, J., S. Hohmann, J. M. Thevelein, and B. A. Prior. 1994. GPD1, which encodes glycerol-3-phosphate dehydrogenase, is essential for growth under osmotic stress in Saccharomyces cerevisiae, and its expression is regulated by the high-osmolarity glycerol response pathway. Mol. Cell. Biol. 144135-4144. - PMC - PubMed
    1. Alepuz, P. M., E. de Nadal, M. Zapater, G. Ammerer, and F. Posas. 2003. Osmostress-induced transcription by Hot1 depends on a Hog1-mediated recruitment of the RNA Pol II. EMBO J. 222433-2442. - PMC - PubMed
    1. Alepuz, P. M., A. Jovanovic, V. Reiser, and G. Ammerer. 2001. Stress-induced map kinase Hog1 is part of transcription activation complexes. Mol. Cell 7767-777. - PubMed
    1. Amberg, D. C., D. J. Burke, and J. N. Strathern. 2006. Yeast RNA isolation: small-scale. Cold Spring Harbor protocol. Cold Spring Harbor Laboratory, Cold Spring Harbor, NY. doi:10.1101/pdb.prot4155. - DOI - PubMed
    1. Brewster, J. L., T. de Valoir, N. D. Dwyer, E. Winter, and M. C. Gustin. 1993. An osmosensing signal transduction pathway in yeast. Science 2591760-1763. - PubMed

Publication types

MeSH terms