. 2009 Apr;29(8):2168-80.
doi: 10.1128/MCB.01508-08. Epub 2009 Feb 9.

c-Jun N-terminal kinase 1 phosphorylates Myt1 to prevent UVA-induced skin cancer

Affiliations

c-Jun N-terminal kinase 1 phosphorylates Myt1 to prevent UVA-induced skin cancer

Hong Seok Choi et al. Mol Cell Biol. 2009 Apr.

Abstract

The c-Jun N-terminal kinase (JNK) signaling pathway is known to mediate both survival and apoptosis of tumor cells. Although JNK1 and JNK2 have been shown to differentially regulate the development of skin cancer, the underlying mechanistic basis remains unclear. Here, we demonstrate that JNK1, but not JNK2, interacts with and phosphorylates Myt1 ex vivo and in vitro. UVA induces substantial apoptosis in JNK wild-type (JNK(+/+)) or JNK2-deficient (JNK2(-/-)) mouse embryonic fibroblasts but has no effect on JNK1-deficient (JNK1(-/-)) cells. In addition, UVA-induced caspase-3 cleavage and DNA fragmentation were suppressed by the knockdown of human Myt1 in skin cancer cells. JNK1 deficiency results in suppressed Myt1 phosphorylation and caspase-3 cleavage in skin exposed to UVA irradiation. In contrast, the absence of JNK2 induces Myt1 phosphorylation and caspase-3 cleavage in skin exposed to UVA. The overexpression of JNK1 with Myt1 promotes cellular apoptosis during the early embryonic development of Xenopus laevis, whereas the presence of JNK2 reduces the phenotype of Myt1-induced apoptotic cell death. Most importantly, JNK1(-/-) mice developed more UVA-induced papillomas than either JNK(+/+) or JNK2(-/-) mice, which was associated with suppressed Myt1 phosphorylation and decreased caspase-3 cleavage. Taken together, these data provide mechanistic insights into the distinct roles of the different JNK isoforms, specifically suggesting that the JNK1-mediated phosphorylation of Myt1 plays an important role in UVA-induced apoptosis and the prevention of skin carcinogenesis.


Figures
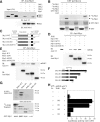
FIG. 1.
FIG. 1.
The interaction of Myt1 with the JNK proteins. (A) JNK1, JNK2, or JNK3 was coimmunoprecipitated with Myt1. The pcDNA3-V5-JNK1, -JNK2, or -JNK3 plasmid was cotransfected with pcDNA3-myc-Myt1 into HEK293 cells and then cultured for 48 h at 37°C in a 5% CO2 incubator. Cells transfected with the pcDNA3-mock vector served as a negative control. The proteins were extracted as described in Materials and Methods and were used for immunoprecipitation (IP) with anti-myc. JNK1, JNK2, and JNK3 were visualized by Western blotting with anti-V5 horseradish peroxidase followed by detection using an ECL detection kit (Amersham Biosciences). (B) In vitro binding with 35S-labeled JNK proteins and a GST-Myt1 fusion protein. The cDNA of each JNK protein was translated in vitro, and then the 35S-JNK proteins were mixed with GST-Myt1 and a pulldown assay was performed. Proteins were visualized by autoradiography. (C) Schematic diagram of full-length (residues 1 to 499) myc-Myt1 (Myt1-WT), the N-terminal fragment (residues 1 to 408) of myc-Myt (Myt1-ΔC91), the C-terminal fragment (residues 103 to 499) of myc-Myt1 (Myt1-ΔN102), or the kinase domain fragment (residues 110 to 321) of myc-Myt1 (Myt1-ΔN102C91). (D and E) The pcDNA3-myc-Myt1-WT, -ΔC91, -ΔN102, or -ΔN102ΔC91 plasmid was transfected with pcDNA3-V5-JNK1 (D) or pcDNA3-V5-JNK3 (E) into HEK293 cells and then cultured for 48 h at 37°C in a 5% CO2 incubator. The cells transfected with the pcDNA3-mock vector served as a negative control. The proteins were extracted as described in Materials and Methods and were used for IP with anti-Myc. JNK1 and JNK3 were visualized by Western blotting with anti-V5 horseradish peroxidase followed by detection using an ECL detection kit (Amersham Biosciences). (F) Schematic diagram of full-length (residues 1 to 427) V5-JNK1 (JNK1-WT) or various deletion mutants of V5-JNK1 (JNK1-D1 [residues 1 to 205], JNK1-D2 [residues 1 to 140], and JNK1-D3 [residues 1 to 60]). (G) In vitro binding with 35S-labeled JNK1-WT or various deletion mutants (JNK1-D1, -D2, or -D3) and a GST-Myt1 fusion protein. The cDNA of JNK1-WT or the deletion mutants (JNK1-D1, -D2, or -D3) was translated in vitro, and then the 35S-labeled JNK1-WT or each respective deletion mutant protein was mixed with GST-Myt1 and a pulldown assay was performed. Proteins were visualized by autoradiography. (H) Ex vivo interaction of pACT-Myt1 with pBIND full-length JNK1 (residues 1 to 427) or each respective deletion mutant. For a negative control, the pACT-Myt1 plasmid was transfected along with the pG5-luc reporter plasmid into NIH 3T3 cells (18,000 cells/ml). The pACT-Myt1 and pBIND-JNK1 plasmids (WT, D1, D2, or D3) were cotransfected with the pG5-luc plasmid to confirm the binding site of Myt1 with JNK1. After a 36-h incubation, the firefly luciferase activity was determined in the cell lysates and normalized against Renilla luciferase activity. All of the experiments were performed at least twice with triplicate samples and are depicted as the means ± standard errors (S.E.). The asterisks indicate a significant increase in activity compared to that for the negative control, pACT-Myt1 only (P < 0.05). The data are shown as relative luciferase activity units (LU) as measured by a Luminoskan Ascent plate reader (Thermo Electron Corp., Helsinki, Finland). (I) Schematic diagram of full-length (residues 1 to 464) V5-JNK3 (JNK1-WT) or various deletion mutants of V5-JNK3 (JNK3-D1 [residues 1 to 240], JNK3-D2 [residues 241 to 464], JNK3-D3 [residues 75 to 464], and JNK3-D4 [residues 101 to 464]). (J) In vitro binding with 35S-labeled JNK3-WT or various deletion mutants (JNK3-D1, -D2, -D3, or -D4) and a GST-Myt1 fusion protein. The cDNA of JNK3-WT or each respective deletion mutant (JNK3-D1, -D2, -D3, or -D4) was translated in vitro; then, the 35S-labeled JNK3-WT or individual deletion mutant protein was mixed with GST-Myt, and a pulldown assay was performed. Proteins were visualized by autoradiography. (K) Ex vivo interaction of pACT-Myt1 with pBIND full-length JNK3 (residues 1 to 464) or each respective deletion mutant. For a negative control, the pACT-Myt1 plasmid was transfected along with the pG5-luc reporter plasmid into NIH 3T3 cells (18,000 cells/ml). The pACT-Myt1 and pBIND-JNK3 plasmids (WT, D1, D2, D3, or D4) were cotransfected with the pG5-luc plasmid to confirm the binding site of Myt1 with JNK3. After a 36-h incubation, firefly luciferase activity was determined in the cell lysates and normalized against Renilla luciferase activity. All of the experiments were performed at least twice with triplicate samples and are depicted as means ± S.E. The asterisks indicate a significant increase in activity compared to that for the negative control, pACT-Myt1 only (P < 0.05). The data are shown as relative luciferase activity units (LU) as measured by a Luminoskan Ascent plate reader (Thermo Electron Corp., Helsinki, Finland).
FIG. 1.
FIG. 1.
The interaction of Myt1 with the JNK proteins. (A) JNK1, JNK2, or JNK3 was coimmunoprecipitated with Myt1. The pcDNA3-V5-JNK1, -JNK2, or -JNK3 plasmid was cotransfected with pcDNA3-myc-Myt1 into HEK293 cells and then cultured for 48 h at 37°C in a 5% CO2 incubator. Cells transfected with the pcDNA3-mock vector served as a negative control. The proteins were extracted as described in Materials and Methods and were used for immunoprecipitation (IP) with anti-myc. JNK1, JNK2, and JNK3 were visualized by Western blotting with anti-V5 horseradish peroxidase followed by detection using an ECL detection kit (Amersham Biosciences). (B) In vitro binding with 35S-labeled JNK proteins and a GST-Myt1 fusion protein. The cDNA of each JNK protein was translated in vitro, and then the 35S-JNK proteins were mixed with GST-Myt1 and a pulldown assay was performed. Proteins were visualized by autoradiography. (C) Schematic diagram of full-length (residues 1 to 499) myc-Myt1 (Myt1-WT), the N-terminal fragment (residues 1 to 408) of myc-Myt (Myt1-ΔC91), the C-terminal fragment (residues 103 to 499) of myc-Myt1 (Myt1-ΔN102), or the kinase domain fragment (residues 110 to 321) of myc-Myt1 (Myt1-ΔN102C91). (D and E) The pcDNA3-myc-Myt1-WT, -ΔC91, -ΔN102, or -ΔN102ΔC91 plasmid was transfected with pcDNA3-V5-JNK1 (D) or pcDNA3-V5-JNK3 (E) into HEK293 cells and then cultured for 48 h at 37°C in a 5% CO2 incubator. The cells transfected with the pcDNA3-mock vector served as a negative control. The proteins were extracted as described in Materials and Methods and were used for IP with anti-Myc. JNK1 and JNK3 were visualized by Western blotting with anti-V5 horseradish peroxidase followed by detection using an ECL detection kit (Amersham Biosciences). (F) Schematic diagram of full-length (residues 1 to 427) V5-JNK1 (JNK1-WT) or various deletion mutants of V5-JNK1 (JNK1-D1 [residues 1 to 205], JNK1-D2 [residues 1 to 140], and JNK1-D3 [residues 1 to 60]). (G) In vitro binding with 35S-labeled JNK1-WT or various deletion mutants (JNK1-D1, -D2, or -D3) and a GST-Myt1 fusion protein. The cDNA of JNK1-WT or the deletion mutants (JNK1-D1, -D2, or -D3) was translated in vitro, and then the 35S-labeled JNK1-WT or each respective deletion mutant protein was mixed with GST-Myt1 and a pulldown assay was performed. Proteins were visualized by autoradiography. (H) Ex vivo interaction of pACT-Myt1 with pBIND full-length JNK1 (residues 1 to 427) or each respective deletion mutant. For a negative control, the pACT-Myt1 plasmid was transfected along with the pG5-luc reporter plasmid into NIH 3T3 cells (18,000 cells/ml). The pACT-Myt1 and pBIND-JNK1 plasmids (WT, D1, D2, or D3) were cotransfected with the pG5-luc plasmid to confirm the binding site of Myt1 with JNK1. After a 36-h incubation, the firefly luciferase activity was determined in the cell lysates and normalized against Renilla luciferase activity. All of the experiments were performed at least twice with triplicate samples and are depicted as the means ± standard errors (S.E.). The asterisks indicate a significant increase in activity compared to that for the negative control, pACT-Myt1 only (P < 0.05). The data are shown as relative luciferase activity units (LU) as measured by a Luminoskan Ascent plate reader (Thermo Electron Corp., Helsinki, Finland). (I) Schematic diagram of full-length (residues 1 to 464) V5-JNK3 (JNK1-WT) or various deletion mutants of V5-JNK3 (JNK3-D1 [residues 1 to 240], JNK3-D2 [residues 241 to 464], JNK3-D3 [residues 75 to 464], and JNK3-D4 [residues 101 to 464]). (J) In vitro binding with 35S-labeled JNK3-WT or various deletion mutants (JNK3-D1, -D2, -D3, or -D4) and a GST-Myt1 fusion protein. The cDNA of JNK3-WT or each respective deletion mutant (JNK3-D1, -D2, -D3, or -D4) was translated in vitro; then, the 35S-labeled JNK3-WT or individual deletion mutant protein was mixed with GST-Myt, and a pulldown assay was performed. Proteins were visualized by autoradiography. (K) Ex vivo interaction of pACT-Myt1 with pBIND full-length JNK3 (residues 1 to 464) or each respective deletion mutant. For a negative control, the pACT-Myt1 plasmid was transfected along with the pG5-luc reporter plasmid into NIH 3T3 cells (18,000 cells/ml). The pACT-Myt1 and pBIND-JNK3 plasmids (WT, D1, D2, D3, or D4) were cotransfected with the pG5-luc plasmid to confirm the binding site of Myt1 with JNK3. After a 36-h incubation, firefly luciferase activity was determined in the cell lysates and normalized against Renilla luciferase activity. All of the experiments were performed at least twice with triplicate samples and are depicted as means ± S.E. The asterisks indicate a significant increase in activity compared to that for the negative control, pACT-Myt1 only (P < 0.05). The data are shown as relative luciferase activity units (LU) as measured by a Luminoskan Ascent plate reader (Thermo Electron Corp., Helsinki, Finland).
FIG. 2.
FIG. 2.
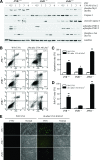
JNK1 mediates the UVA-induced phosphorylation of Myt1. (A) In vitro phosphorylation of GST-Myt1 by active JNK1, JNK2, or JNK3. A GST-Myt1 protein was incubated with active JNK1, JNK2, or JNK3 protein (1 μg) for 60 min at 30°C for an in vitro kinase assay, and the 32P-labeled Myt1 was visualized by autoradiography. For visualizing the equal loading of protein, total GST-Myt1 was detected by Coomassie blue staining (bottom panel). The figures are representative of at least two separate experiments that yielded similar results. auto-p, autophosphorylation. (B) In vitro phosphorylation of GST-Myt1 by UVA-induced JNK1 activation. SK-MEL-28 cells were seeded and cultured for 24 h in 10% FBS-MEM in a 37°C, 5% CO2 incubator. The cells were then starved in serum-deprived MEM for 24 h, exposed or not exposed to UVA (40 kJ/m2), and harvested after incubation for the time indicated. Immunoprecipitation (IP) was performed to precipitate endogenous JNK1, and then the GST-Myt1 protein was incubated with the immunoprecipitated active JNK1 protein for 60 min at 30°C for an in vitro kinase assay and the 32P-labeled Myt1 was visualized by autoradiography. For visualizing UVA-induced JNK activity, the phosphorylation of JNKs was detected by immunoblotting (IB) using the total cell lysate (bottom panel). (C and D) Interaction of endogenous JNK1 or JNK2 with Myt1 stimulated by UVA. SK-MEL-28 cells were seeded and cultured for 24 h in 10% FBS-MEM in a 37°C, 5% CO2 incubator. The cells were then starved in serum-deprived MEM for 24 h, then exposed or not exposed to UVA (40 kJ/m2), and harvested after incubation for the time indicated (C) or 6 h (D). IP was performed to precipitate endogenous JNK1 (C or D) or JNK2 (D), and then the Myt1 protein was detected by IB with anti-Myt1. (E) The effect of the UVA-induced phosphorylation of Myt1 on CDK activity after JNK gene ablation. JNK+/+, JNK1−/−, or JNK2−/− MEFs were seeded and cultured for 24 h in 10% FBS-MEM in a 37°C, 5% CO2 incubator and then starved in serum-deprived MEM for 24 h. Cells treated or not treated with UVA (40 kJ/m2) for the indicated times were harvested, lysed, and resolved by SDS-PAGE. Western blot analysis was carried out using antibodies against the respective proteins.
FIG. 3.
FIG. 3.
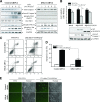
JNK1 deficiency causes a reduction in cellular apoptosis. (A) Time-course analysis of the UVA-induced phosphorylation of Myt1 after gene ablation. JNK+/+, JNK1−/−, or JNK2−/− MEFs were seeded and cultured for 24 h in 10% FBS-MEM in a 37°C, 5% CO2 incubator and then starved in serum-deprived MEM for 24 h. Cells treated or not treated with UVA (40 kJ/m2) for the indicated times were harvested, lysed, and resolved by SDS-PAGE. Western blot analysis was carried out using antibodies against the respective proteins. (B) Flow cytometry analysis of UVA-induced apoptosis of JNK+/+, JNK1−/−, or JNK2−/− MEFs. Cells were incubated with annexin V-FITC and propidium iodide 24 h after treatment with UVA (40 kJ/m2). Untreated cells were used as controls. The distribution pattern of the live and apoptotic cells was analyzed by flow cytometry using the Becton Dickinson FACSCalibur flow cytometer, as described in Materials and Methods. In the bottom left quadrants of each plot, viable cells are those displaying low annexin or no annexin and propidium iodide staining. In the bottom right quadrants, early-stage apoptotic cells are represented by high annexin and low propidium iodide staining. In the top right quadrants, late-stage apoptotic cells are represented by high annexin and high propidium iodide staining. In the top left quadrants, necrosis is represented by cells with high propidium iodide and low annexin staining. These data are representative of the results from at least three independent experiments. (C) Percentage of apoptosis in UVA-treated cells compared with that of the untreated cells. Data are represented as the means of the results from three independent experiments ± standard deviations (S.D.). The asterisks indicate a significant increase in apoptosis induced by UVA compared with that of the untreated control cells (*, P < 0.005; **, P < 0.001). (D) Effect of UVA on the sub-G1 distribution of JNK+/+, JNK1−/−, or JNK2−/− MEFs. Cells were seeded and allowed to attach overnight. Cells were then exposed to UVA (40 kJ/m2), and 24 h later, total cells (floating and attached) were fixed, stained with propidium iodide, and analyzed by flow cytometry. The percentage of cell staining with <2 N DNA content (sub-G1) for UVA-treated cells was compared with that for untreated cells. Data are represented as the means of the results from three independent experiments ± S.D. The asterisks indicate a significant increase in the distribution of sub-G1 cells induced by UVA compared with that for untreated control cells (**, P < 0.001). (E) TUNEL analysis of UVA-induced apoptosis in JNK+/+, JNK1−/−, or JNK2−/− MEFs. Apoptosis was evaluated by the TUNEL assay as a measure of DNA fragmentation. Cells were exposed or not exposed to UVA (40 kJ/m2) and harvested 6 h later as described in Materials and Methods. Large numbers of TUNEL-positive cells were observed in JNK+/+ and JNK2−/− MEFs, but not in JNK1−/− cells, after UVA exposure. Reproducible results were obtained in three independent experiments, and representative photomicrographs are shown.
FIG. 4.
FIG. 4.
Myt1 knockdown inhibits UVA-induced cellular apoptosis. (A) Time-course analysis of the UVA-induced signaling to apoptosis in Myt1 knockdown SK-MEL-28 cells. Cells were seeded and cultured for 24 h in 10% FBS-MEM in a 37°C, 5% CO2 incubator and then transfected with siRNA against human Myt1 (hMyt1). At 24 h after the transfection of hMyt1 siRNA, cells were starved for an additional 24 h, then treated or not treated with UVA (40 kJ/m2), and harvested at the indicated time point. Cells were disrupted and proteins resolved by SDS-PAGE. Western blot analysis was carried out using antibodies against the respective proteins. (B) Comparison of cell viability and caspase-3 activation stimulated by UVA in Myt1-WT- or Myt1-ΔN102C91-overexpressing SK-MEL-28 cells. Cells were seeded and cultured for 24 h in 10% FBS-MEM in a 37°C, 5% CO2 incubator and then transfected with the mock vector, Myt1-WT, or Myt1-ΔN102C91, respectively. At 24 h after transfection, cells were starved for an additional 24 h, then treated or not treated with UVA (40 kJ/m2), and incubated for 12 h. Cells were harvested and disrupted and proteins resolved by SDS-PAGE. Western blot analysis was carried out using antibodies against the respective proteins. (C) Flow cytometry analysis of UVA-induced apoptosis in control siRNA- or hMyt1 siRNA-transfected cells. Cells transfected with control siRNA or hMyt1 siRNA were incubated with annexin V-FITC and propidium iodide 24 h after treatment with UVA (40 kJ/m2). Untreated cells were used as controls. The distribution pattern of live and apoptotic cells was analyzed by flow cytometry using the Becton Dickinson FACSCalibur flow cytometer, as described in Materials and Methods. These data are representative of the results from at least three independent experiments. (D) The percentage of apoptosis in UVA-treated cells is compared with that for untreated cells, and the data represent the means ± standard deviations of the results from three independent experiments. The asterisks indicate a significant decrease in apoptosis induced by UVA in hMyt1 siRNA-treated cells compared with that in control siRNA-treated cells (*, P < 0.005). (E) TUNEL analysis of UVA-induced apoptosis in control siRNA- or hMyt1 siRNA-transfected cells. Apoptosis was evaluated by the TUNEL assay as a measure of DNA fragmentation. Control siRNA- or hMyt1 siRNA-transfected cells were exposed or not exposed to UVA (40 kJ/m2) and harvested after 12 h as described in Materials and Methods. Substantially more TUNEL-positive cells were observed for control siRNA-transfected SK-MEL-28 cells after exposure to UVA than for hMyt1-transfected SK-MEL-28 cells. Reproducible results were obtained from three independent experiments, and representative photomicrographs are shown.
FIG. 5.
FIG. 5.
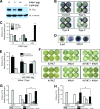
Overexpression of Myt1 results in apoptosis during gastrulation. (A) Xenopus embryos were injected at the one-cell stage with the mRNA of Myt1 at the indicated dose or 100 pg of β-Gal (negative control). Embryos were collected, and lysates were subjected to immunoblotting using anti-Flag. (B) Xenopus embryos injected with the mRNA of β-Gal or human Myt1 were photographed. Control, normal embryos at stage 12 derived from one-cell-stage embryos that were injected with the mRNA of β-Gal (100 pg) as a control; Type A, Type B, and Type C, embryos derived from one-cell-stage embryos that were injected with the mRNA of Myt1. The types of embryos were classified as type A, type B, or type C based on the severity of the phenotypic defect. (C) Histogram representing the number of phenotypic changes induced by Myt1. The asterisks indicate a significant increase in lethality compared to that for the control (P < 0.05). These data are representative of the results from three independent experiments. (D) Whole-mount TUNEL assay. Albino embryos injected with the mRNA of Myt1 (50 pg) or β-Gal (50 pg) were fixed at stage 11 and processed for TUNEL staining. A positive TUNEL reaction is indicated by purple staining of the nuclei. (E) One-cell-stage Xenopus embryos were injected with the mRNA of Myt1 (70 pg) with/without that of DN-JNK1 (0.5 or 1.0 ng). The histogram represents the number of phenotypic changes. The asterisks indicate a significant decrease in dissociation compared to that for the control (P < 0.05). These data are representative of the results from three independent experiments. (F) One-cell-stage Xenopus embryos were injected with the mRNA of Myt1 (50 pg) with/without human JNK1 or human JNK2 (200 pg of each). The embryos shown were photographed at stage 12. (G and H) Histograms representing the number of phenotypic changes induced by Myt1 with/without JNK1 (G) or JNK2 (H). The asterisks indicate a significant increase (G) or decrease (H) in dissociation/death compared to that of the control (P < 0.05). These data are representative of the results from three independent experiments.
FIG. 6.
FIG. 6.
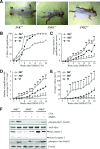
The JNK1-mediated phosphorylation of Myt1 inhibits UVA-induced skin tumorigenesis in vivo. (A) External appearance of papillomas. Mice received one topical dose of DMBA (200 nmol in 250 μl acetone) and 2 weeks later were exposed to increasing doses of UVA five times a week (Monday through Friday) as follows: week 1, 4,200 J/m2 or 3.5 min; week 2, 8,400 J/m2 or 7 min; week 3, 16,800 J/m2 or 14 min; week 4, 33,600 J/m2 or 28 min; week 5, 67,200 J/m2 or 56 min; week 6, 100,800 J/m2 or 84 min; and weeks 7 to 18, 144,000 J/m2 or 120 min. Mice were monitored and treated with UVA for 18 weeks after DMBA initiation treatment. (B) Fewer JNK2−/− mice than JNK+/+ or JNK1−/− mice developed papillomas after exposure to UVA. (C) The average numbers of papillomas were significantly different among groups. A single asterisk indicates significantly (P < 0.05) fewer papillomas for JNK2−/− mice than for JNK1−/− or JNK+/+ mice, and double asterisks indicate significantly (P < 0.05) more papillomas for JNK1−/− mice than for JNK2−/− or JNK+/+ mice. Data are expressed as means ± standard errors (S.E.). (D) The average numbers of papillomas of >1.5 mm3 were significantly different among groups. A single asterisk indicates significantly (P < 0.05) fewer papillomas of >1.5 mm3 for JNK2−/− mice than for JNK1−/− or JNK+/+ mice, and double asterisks indicate significantly (P < 0.05) more papillomas of >1.5 mm3 for JNK1−/− mice than for JNK2−/− or JNK+/+ mice. Data are expressed as means ± S.E. (E) Average papilloma volumes were significantly different among groups. A single asterisk indicates significantly (P < 0.05) smaller papillomas for JNK2−/− mice than for JNK1−/− or JNK+/+ mice, and double asterisks indicate significantly (P < 0.05) larger papillomas for JNK1−/− mice than for JNK2−/− or JNK+/+ mice. Data are expressed as means ± S.E. (F) Effect of UVA on the phosphorylation of Myt1 and the activity of caspase-3 in JNK WT and JNK-deficient mice. The dorsal skins from JNK+/+, JNK1−/−, and JNK2−/− mice were biopsied, and the total lysates were analyzed by immunoblotting using antibodies against the respective proteins. Reproducible results were obtained in three independent experiments, and representative blots are shown.

Similar articles

Cited by

References

    1. Bachelor, M. A., and G. T. Bowden. 2004. UVA-mediated activation of signaling pathways involved in skin tumor promotion and progression. Semin. Cancer Biol. 14131-138. - PubMed
    1. Bode, A. M., and Z. Dong. 2007. The functional contrariety of JNK. Mol. Carcinog. 46591-598. - PMC - PubMed
    1. Caffrey, D. R., L. A. O'Neill, and D. C. Shields. 1999. The evolution of the MAP kinase pathways: coduplication of interacting proteins leads to new signaling cascades. J. Mol. Evol. 49567-582. - PubMed
    1. Carter, A. D., and J. C. Sible. 2003. Loss of XChk1 function triggers apoptosis after the midblastula transition in Xenopus laevis embryos. Mech. Dev. 120315-323. - PubMed
    1. Chang, H. Y., and X. Yang. 2000. Proteases for cell suicide: functions and regulation of caspases. Microbiol. Mol. Biol. Rev. 64821-846. - PMC - PubMed

Publication types