Randomized Controlled Trial
. 2009 Feb 9;169(3):269-78.
doi: 10.1001/archinternmed.2008.545.

Exercise dose and quality of life: a randomized controlled trial

Affiliations
Randomized Controlled Trial

Exercise dose and quality of life: a randomized controlled trial

Corby K Martin et al. Arch Intern Med. .

Abstract

Background: Improved quality of life (QOL) is a purported benefit of exercise, but few randomized controlled trials and no dose-response trials have been conducted to examine this assertion.

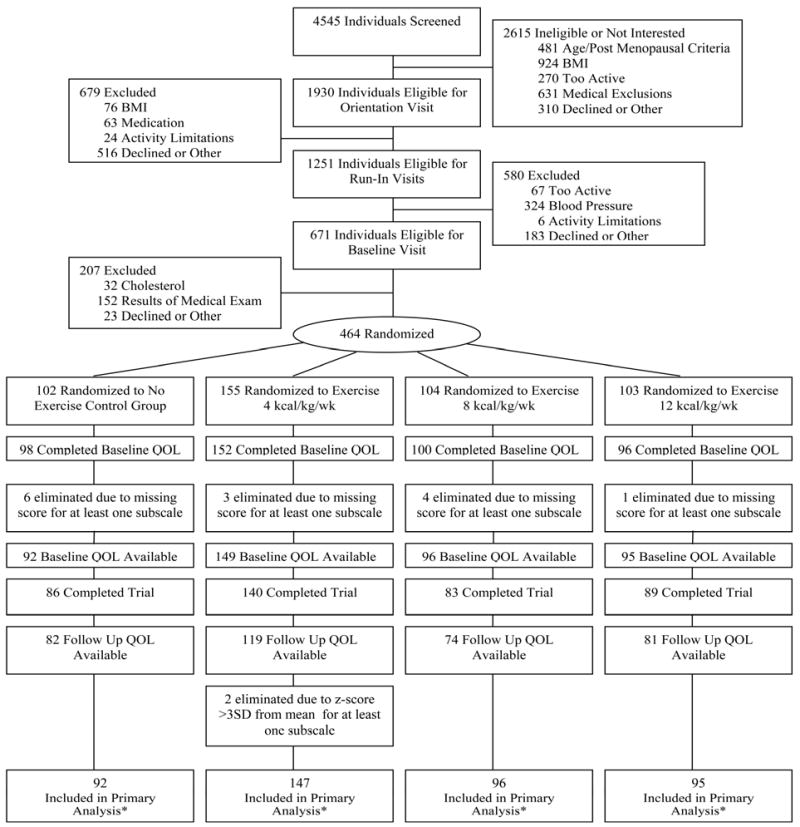
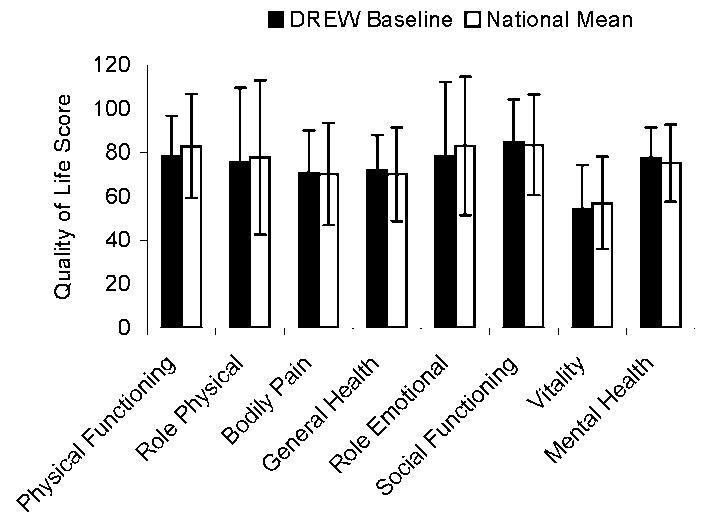
Methods: The effect of 50%, 100%, and 150% of the physical activity recommendation on QOL was examined in a 6-month randomized controlled trial. Participants were 430 sedentary postmenopausal women (body mass index range, 25.0-43.0 [calculated as weight in kilograms divided by height in meters squared]) with elevated systolic blood pressure randomized to a nonexercise control group (n = 92) or 1 of 3 exercise groups: exercise energy expenditure of 4 (n = 147), 8 (n = 96), or 12 (n = 95) kilocalories per kilogram of body weight per week. Eight aspects of physical and mental QOL were measured at baseline and month 6 with the use of the Medical Outcomes Study 36-Item Short Form Health Survey.

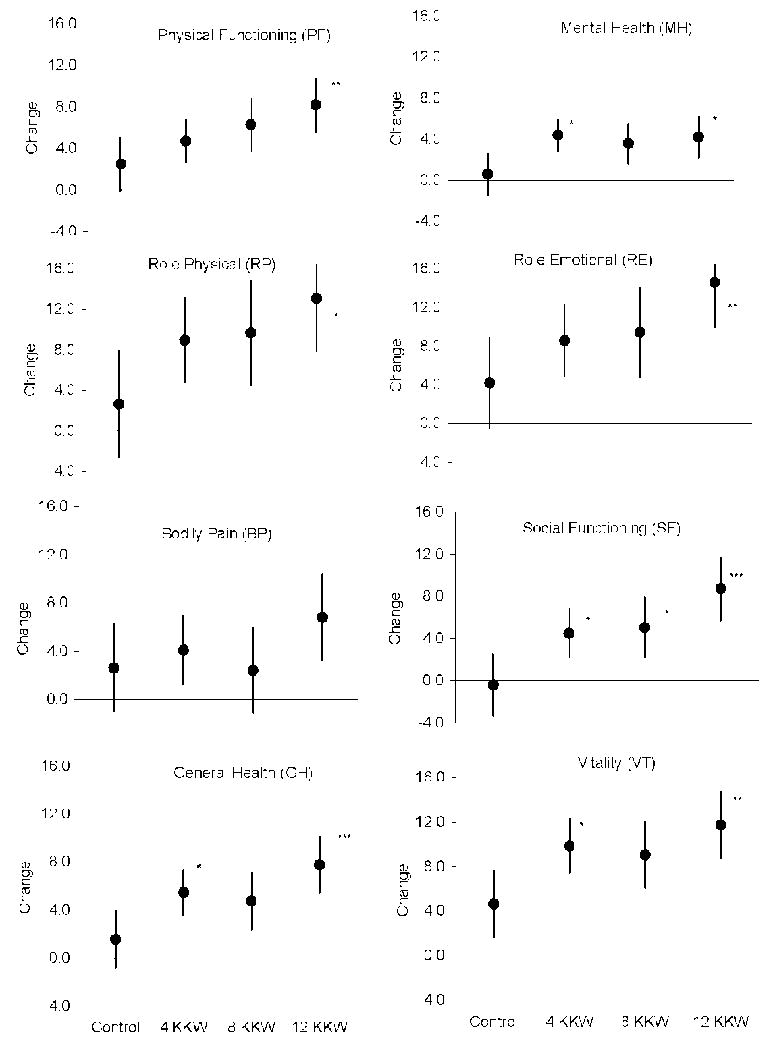
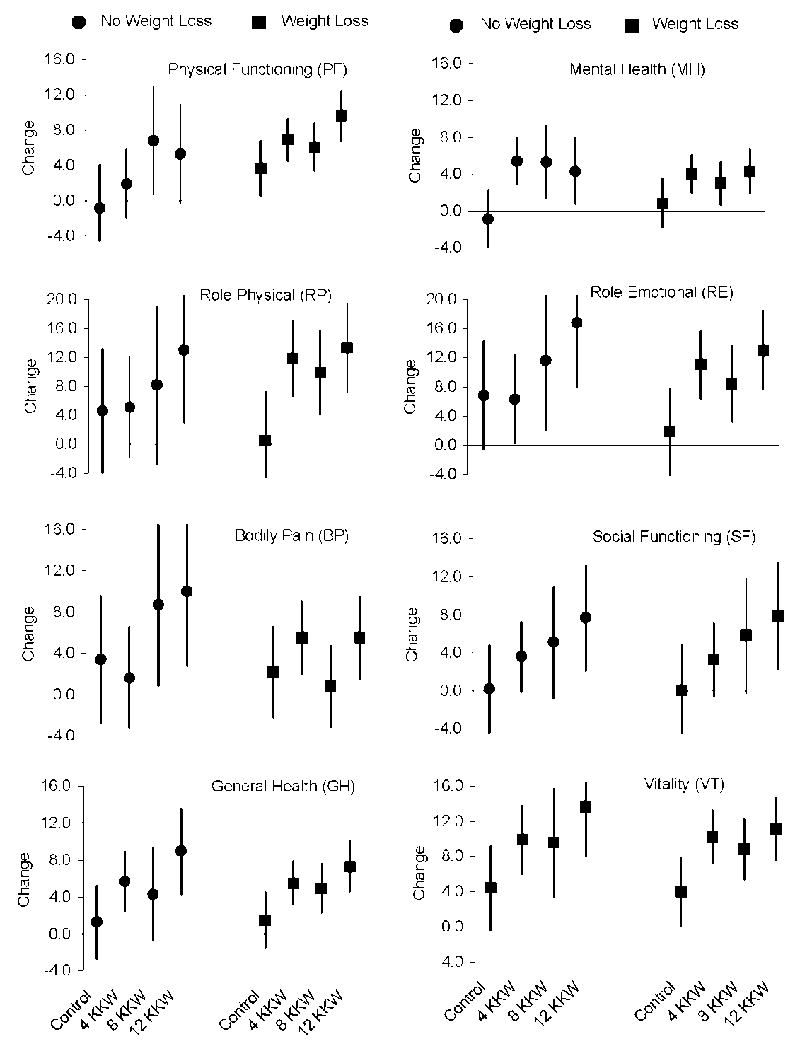
Results: Change in all mental and physical aspects of QOL, except bodily pain, was dose dependent (trend analyses were significant, and exercise dose was a significant predictor of QOL change; P < .05). Higher doses of exercise were associated with larger improvements in mental and physical aspects of QOL. Controlling for weight change did not attenuate the exercise-QOL association.

Conclusion: Exercise-induced QOL improvements were dose dependent and independent of weight change.

Trial registration: ClinicalTrials.gov NCT00011193.


Figures

Figure 1
Figure 1
CONSORT diagram describing recruitment and retention of participants. *Baseline values were carried forward if follow-up QOL scores were missing.
Figure 2
Figure 2
Mean (± SD) baseline SF-36 scores for the DREW sample and the national mean for the United States. The mean QOL scores for the DREW sample differed from the national mean by only 0.02 to 0.22 standard deviation units, which are considered differences of small magnitude .
Figure 3
Figure 3
Mean change (Least-squares means ± 95% confidence interval) on SF-36 measures across the control and exercise groups. The dose-response relations between exercise dose and change in QOL were evaluated with regression analysis to test for trends in QOL change across groups. Significant trends were found for all QOL scales (all p-values < 0.0001), with exercise dose being an independent predictor of change in PF, t(1) = 3.19, p=0.002; RP, t(1) = 2.62, p=0.009; GH, t(1) = 3.21, p=0.001; MH, t(1) = 2.03, p=0.044; RE, t(1) = 3.00, p=0.003; SF, t(1) = 4.17, p<0.0001; and VT, t(1) = 2.88, p=0.004; but not BP, t(1) = 1.31, p=0.192. Differences in QOL change across groups were tested by analysis of covariance (ANCOVA) with adjustment for pre-specified covariates (age, antidepressant use, BMI, employment status, ethnicity, marital status, and smoking status at baseline). Significant ANCOVAs (p < .05) were followed by pair-wise comparisons to test if the exercise groups differed significantly from the control group. The alpha level was set a 0.0167 (.05/3=0.0167) and all p-values were multiplied by three; hence, the following notation was used to depict statistical significance: *p < .05, **p < .01, ***p < .001. For significant comparisons, the LS mean differences (95% confidence intervals) between the 12 KKW and control group follow: PF 5.7 (1.2-10.2), RP 10.4 (1.3-19.5), GH 6.2 (2.1-10.4), MH 3.6 (0.2-7.1), RE 10.4 (2.3-18.4), SF 9.1 (4.1-14.2), and VT 7.1 (1.9-12.2). Similarly, significant LS mean differences (95% CI) between the 4 KKW and control group were: GH 3.9 (0.2-7.6), VT 5.2 (0.5-9.9), SF 4.9 (0.3-9.4), and MH 3.8 (0.7-6.9). The 8 KKW significantly improved SF compared to control 5.4 (0.4-10.4).
Figure 4
Figure 4
Change in SF-36 scores across the exercise groups was examined for two subgroups of participants: 1) those who lost weight vs. 2) those who maintained or gained weight, using analysis of covariance (ANCOVA) with baseline age, antidepressant use, employment status, ethnicity, marital status, and smoking status as covariates. Mean change (Least-squares means ± 95% confidence interval) on SF-36 scales across the control and exercise groups for participants who did and did not lose weight are depicted. The results from the ANCOVAs follow: PF, F(3, 416) = 0.12, p=0.95; RP, F(3, 416) = 1.00, p=0.39; BP, F(3, 416) = 1.41, p=0.24; GH, F(3, 416) = 0.28, p=0.84; MH (3, 416) = 0.18, p=0.91; RE, F(3, 416) = 2.41, p=0.07; SF, F(3, 416) = 0.87, p=0.46; and VT, F(3, 416) = 0.11, p=0.95. These non-significant interactions indicate that the pattern of change in each of the SF-36 measures across the exercise groups was similar for those who did and did not lose weight.

Similar articles

Cited by

References

    1. Blair SN, Kohl HW, 3rd, Barlow CE, Paffenbarger RS, Jr, Gibbons LW, Macera CA. Changes in physical fitness and all-cause mortality. A prospective study of healthy and unhealthy men. JAMA. 1995;273:1093–1098. - PubMed
    1. Blair SN, Kohl HW, 3rd, Paffenbarger RS, Jr, Clark DG, Cooper KH, Gibbons LW. Physical fitness and all-cause mortality. A prospective study of healthy men and women. JAMA. 1989;262:2395–2401. - PubMed
    1. Gulati M, Pandey DK, Arnsdorf MF, et al. Exercise capacity and the risk of death in women: The St James Women Take Heart Project. Circulation. 2003;108:1554–1559. - PubMed
    1. Mora S, Redberg RF, Cui Y, et al. Ability of exercise testing to predict cardiovascular and all-cause death in asymptomatic women: A 20-year follow-up of the lipid research clinics prevalence study. JAMA. 2003;290:1600–1607. - PubMed
    1. Myers J, Prakash M, Froelicher V, Do D, Partington S, Atwood JE. Exercise capacity and mortality among men referred for exercise testing. N Engl J Med. 2002;346:793–801. - PubMed

Publication types

Substances

Associated data