. 2009 Mar 3;106(9):3243-8.
doi: 10.1073/pnas.0806852106. Epub 2009 Feb 9.

Absolute humidity modulates influenza survival, transmission, and seasonality

Affiliations

Absolute humidity modulates influenza survival, transmission, and seasonality

Jeffrey Shaman et al. Proc Natl Acad Sci U S A. .

Abstract

Influenza A incidence peaks during winter in temperate regions. The basis for this pronounced seasonality is not understood, nor is it well documented how influenza A transmission principally occurs. Previous studies indicate that relative humidity (RH) affects both influenza virus transmission (IVT) and influenza virus survival (IVS). Here, we reanalyze these data to explore the effects of absolute humidity on IVT and IVS. We find that absolute humidity (AH) constrains both transmission efficiency and IVS much more significantly than RH. In the studies presented, 50% of IVT variability and 90% of IVS variability are explained by AH, whereas, respectively, only 12% and 36% are explained by RH. In temperate regions, both outdoor and indoor AH possess a strong seasonal cycle that minimizes in winter. This seasonal cycle is consistent with a wintertime increase in IVS and IVT and may explain the seasonality of influenza. Thus, differences in AH provide a single, coherent, more physically sound explanation for the observed variability of IVS, IVT and influenza seasonality in temperate regions. This hypothesis can be further tested through future, additional laboratory, epidemiological and modeling studies.


Conflict of interest statement

The authors declare no conflict of interest.

Figures
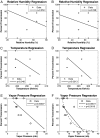
Fig. 1.
Fig. 1.
IVT response to RH, temperature, and VP. (Left) Regression of guinea pig IVT data (8) (n = 20) on RH (A), temperature (C), and VP (E). (Right) Regression of larger guinea pig IVT dataset (8, 11) (n = 24) on RH (B), temperature (D), and VP (F). Significance of each model fit was assessed by using the t statistic for which the P value is shown in the legend. Symbols are the data; the black lines are linear regression model solutions. The dashed line plots the regression of log(percent transmission).
Fig. 2.
Fig. 2.
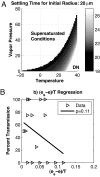
Modeled droplet nuclei formation and IVT response to evaporation rates. (A) Time in seconds for a spherical droplet of pure water and initial radius of 20 μm to fall 1 m in different temperature and vapor pressure conditions. Conditions represented by the white area in the upper left of the plot were not modeled, because these represent supersaturated humidity levels. Droplets in the lower right area of the plot (labeled DN) evaporated to r ≤ 2μm and were assumed to remain aloft as droplet nuclei. (B) Regression of IVT data (8, 11) (n = 24) on the ratio of vapor pressure deficit to temperature [(ese)/T]. This regression model is not statistically significant (P = 0.11).
Fig. 3.
Fig. 3.
IVS response to RH, temperature, and VP. (Left) Scatter plots of IVS data (15) (n = 11) at 1, 6, and 23 h after aerosol generation plotted versus RH (A), temperature (C), and VP (E). (Right) Linear regression of log(percent viable) at 1 h on RH (B), temperature (D), and VP (F). Significance of each model fit was assessed by using the t statistic for which the P value is shown in the legend. Symbols are the data; the black lines are regression model solutions.
Fig. 4.
Fig. 4.
Seasonal variations of VP and RH. (A) Plot of the monthly seasonal cycle of indoor VP in millibars and indoor RH in percent. Data are living room measurements taken during 1993–1995 in 8 dwellings in Gothenburg Sweden (31). (B) Plot of the monthly seasonal cycle of outdoor VP in millibars and outdoor RH in percent at the surface averaged for 130–70°W and 30–60°N. Data are National Center for Environmental Prediction–National Center for Atmospheric Research (NCEP–NCAR) reanalysis for 1968–1996 (32) and were provided by the National Oceanic and Atmospheric Agency/Oceanic and Atmospheric Research/Earth System Research Laboratory, Physical Science Division, Boulder, CO, from their web site at www.cdc.noaa.gov/.

Comment in

  • Influenza seasonality: lifting the fog.
    Lipsitch M, Viboud C. Lipsitch M, et al. Proc Natl Acad Sci U S A. 2009 Mar 10;106(10):3645-6. doi: 10.1073/pnas.0900933106. Proc Natl Acad Sci U S A. 2009. PMID: 19276125 Free PMC article. No abstract available.

References

    1. Brankston G, Gitterman L, Hirji Z, Lemieux C, Gardam M. Transmission of influenza A in human beings. Lancet Infect Dis. 2007;7:257–265. - PubMed
    1. Tellier R. Review of aerosol transmission of influenza a virus. Emerg Infect Dis. 2006;12:1657–1662. - PMC - PubMed
    1. Lemieux C, Brankston G, Gitterman L, Hirji Z, Gardam M. Questioning aerosol transmission of influenza. Emerg Infect Dis. 2007;13:173–174. - PMC - PubMed
    1. Tellier R. Questioning aerosol transmission of influenza: Response. Emerg Infect Dis. 2007;13:174–175. - PMC - PubMed
    1. Tellier R. Transmission of influenza A in human beings. Lancet Infect Dis. 2007;7:759–760. - PubMed

LinkOut - more resources