

T cell receptors in an IL-10-secreting amino acid copolymer-specific regulatory T cell line that mediates bystander immunosuppression
- PMID: 19204292
- PMCID: PMC2651312
- DOI: 10.1073/pnas.0813197106
T cell receptors in an IL-10-secreting amino acid copolymer-specific regulatory T cell line that mediates bystander immunosuppression
Abstract
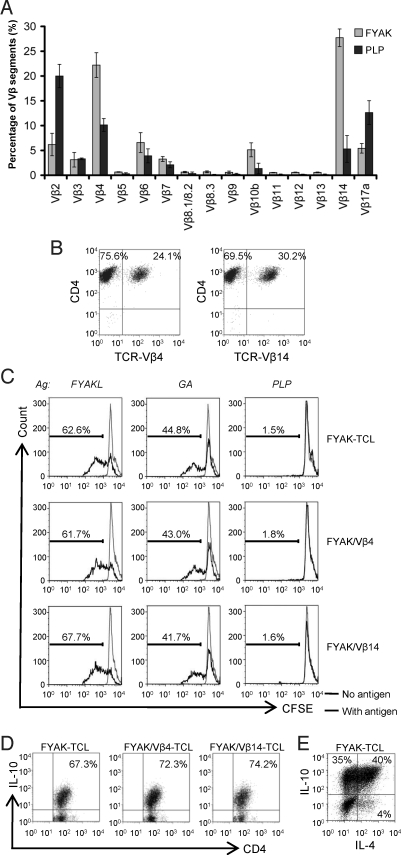
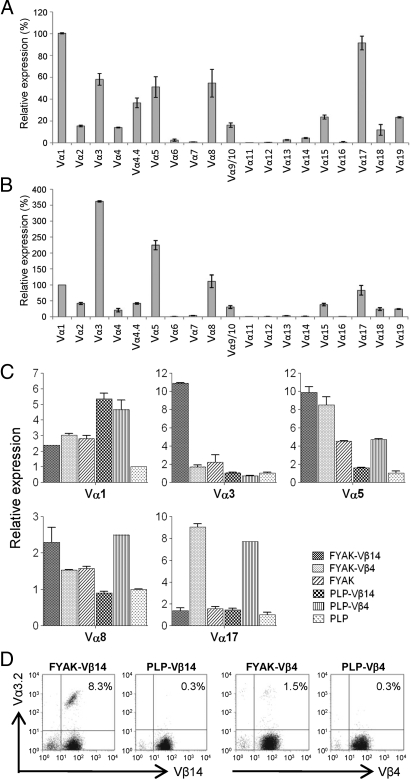
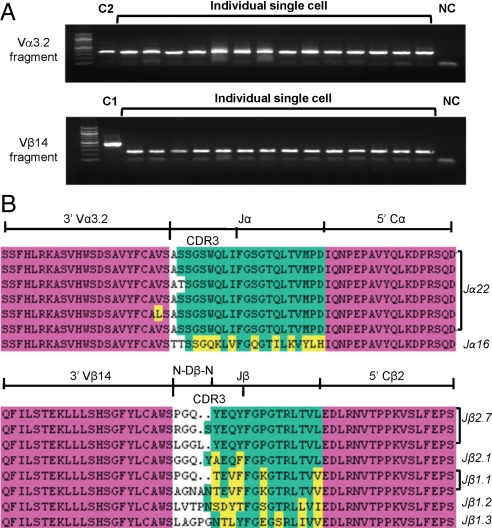
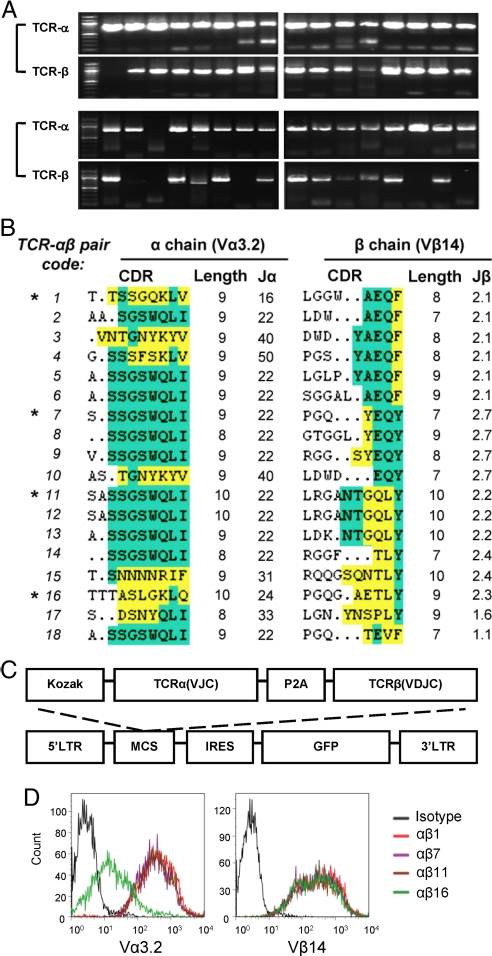
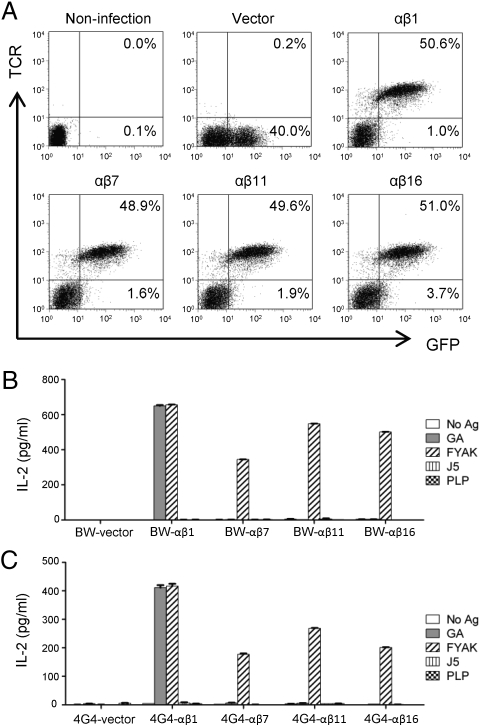
The T cell receptors from the regulatory IL-10-secreting T cell line induced by the random amino acid copolymers poly(F,Y,A,K,)n in SJL mice (H-2(s)) have been characterized, cloned, sequenced and expressed both in 293T cells and in 2 different TCR alpha(-)/beta(-) T cell hybridomas. The usage of TCR alpha and beta V regions in the cell line was oligoclonal. Four TCR alpha/beta pairs cloned from single cells of the T cell line were inserted into a retrovirus vector linked by an oligonucleotide encoding the 2A peptide that spontaneously cleaves in vivo. After cotransfection of this vector with a CD3 vector into the 293T cells, the TCR were surface expressed. Moreover, after transduction into the 2 T cell hybridomas, all 4 were functional as evidenced by their response to stimulation by poly(F,Y,A,K)n. All 4 pairs were Valpha3.2(3.5)/Vbeta14, a prominent clonotype found in the poly(F,Y,A,K)n-specific T cell line. These V regions are identical to those recently found in a regulatory T cell line that secretes both IL-4 and IL-10 induced in B10.PL mice with a different MHC hapotype (H-2(u)) by a small peptide obtained from an autoimmune TCR of that strain. These data lead to a hypothesis regarding the origin of the epigenetic modifications that lead to selective cytokine secretion in T cells.
Conflict of interest statement
Conflict of interest statement: J.L.S. is a member of the Scientific Advisory Board of Peptimmune, Inc., who are developing FYAK for clinical trial.
Figures
Similar articles
-
Genetically modified hematopoietic stem/progenitor cells that produce IL-10-secreting regulatory T cells.Proc Natl Acad Sci U S A. 2019 Feb 12;116(7):2634-2639. doi: 10.1073/pnas.1811984116. Epub 2019 Jan 25. Proc Natl Acad Sci U S A. 2019. PMID: 30683721 Free PMC article.
-
Amino acid copolymer-specific IL-10-secreting regulatory T cells that ameliorate autoimmune diseases in mice.Proc Natl Acad Sci U S A. 2008 Apr 1;105(13):5172-6. doi: 10.1073/pnas.0712131105. Epub 2008 Mar 24. Proc Natl Acad Sci U S A. 2008. PMID: 18362339 Free PMC article.
-
Expression of functional alpha beta T cell receptor gene rearrangements in suppressor T cell hybridomas correlates with antigen binding, but not with suppressor cell function.J Immunol. 1990 Nov 1;145(9):2809-19. J Immunol. 1990. PMID: 2170525
-
The involvement of T cell receptor peptide-specific regulatory CD4+ T cells in recovery from antigen-induced autoimmune disease.J Exp Med. 1993 Sep 1;178(3):909-16. doi: 10.1084/jem.178.3.909. J Exp Med. 1993. PMID: 7688792 Free PMC article.
-
T cell receptor alpha and beta gene expression in a murine antigen-specific T suppressor lymphocyte clone with cytolytic potential.J Immunol. 1991 Jan 15;146(2):775-82. J Immunol. 1991. PMID: 1846162
Cited by
-
Avidity of human T cell receptor engineered CD4(+) T cells drives T-helper differentiation fate.Cell Immunol. 2016 Jan;299:30-41. doi: 10.1016/j.cellimm.2015.10.003. Epub 2015 Oct 23. Cell Immunol. 2016. PMID: 26653006 Free PMC article.
-
Antigenic strength controls the generation of antigen-specific IL-10-secreting T regulatory cells.Eur J Immunol. 2010 May;40(5):1386-95. doi: 10.1002/eji.200940151. Eur J Immunol. 2010. PMID: 20162554 Free PMC article.
-
Genetically modified hematopoietic stem/progenitor cells that produce IL-10-secreting regulatory T cells.Proc Natl Acad Sci U S A. 2019 Feb 12;116(7):2634-2639. doi: 10.1073/pnas.1811984116. Epub 2019 Jan 25. Proc Natl Acad Sci U S A. 2019. PMID: 30683721 Free PMC article.
-
The role of dendritic cells in the generation of CD4(+) CD25(HI) Foxp3(+) T cells induced by amino acid copolymers.Int Immunol. 2013 Jan;25(1):53-65. doi: 10.1093/intimm/dxs087. Epub 2012 Sep 11. Int Immunol. 2013. PMID: 22968996 Free PMC article.
-
Polymeric drugs: Advances in the development of pharmacologically active polymers.J Control Release. 2015 Dec 10;219:369-382. doi: 10.1016/j.jconrel.2015.09.043. Epub 2015 Sep 26. J Control Release. 2015. PMID: 26410809 Free PMC article. Review.
References
-
- Mantovani A, et al. The chemokine system in diverse forms of macrophage activation and polarization. Trends Immunol. 2004;25:677–686. - PubMed
-
- Steinman RM, Hawiger D, Nussenzweig MC. Tolerogenic dendritic cells. Annu Rev Immunol. 2003;21:685–711. - PubMed
-
- Battaglia M, Gregori S, Bacchetta R, Roncarolo MG. Tr1 cells: From discovery to their clinical application. Semin Immunol. 2006;18:120–127. - PubMed
-
- Hawrylowicz CM, O'Garra A. Potential role of interleukin-10-secreting regulatory T cells in allergy and asthma. Nat Rev Immunol. 2005;5:271–283. - PubMed
-
- Izcue A, Coombes JL, Powrie F. Regulatory T cells suppress systemic and mucosal immune activation to control intestinal inflammation. Immunol Rev. 2006;212:256–271. - PubMed
Publication types
MeSH terms
Substances
Grants and funding
LinkOut - more resources
Full Text Sources
Other Literature Sources
Research Materials
