. 2009 May 7;113(19):4575-85.
doi: 10.1182/blood-2008-10-185223. Epub 2009 Feb 9.

The molecular signature of CD8+ T cells undergoing deletional tolerance

Affiliations

The molecular signature of CD8+ T cells undergoing deletional tolerance

Ian A Parish et al. Blood. .

Abstract

Peripheral tolerance induction is critical for the maintenance of self-tolerance and can be mediated by immunoregulatory T cells or by direct induction of T-cell anergy or deletion. Although the molecular processes underlying anergy have been extensively studied, little is known about the molecular basis for peripheral T-cell deletion. Here, we determined the gene expression signature of peripheral CD8(+) T cells undergoing deletional tolerance, relative to those undergoing immunogenic priming or lymphopenia-induced proliferation. From these data, we report the first detailed molecular signature of cells undergoing deletion. Consistent with defective cytolysis, these cells exhibited deficiencies in granzyme up-regulation. Furthermore, they showed antigen-driven Bcl-2 down-regulation and early up-regulation of the proapoptotic protein Bim, consistent with the requirement of this BH3-only protein for peripheral T-cell deletion. Bim up-regulation was paralleled by defective interleukin-7 receptor alpha (IL-7Ralpha) chain reexpression, suggesting that Bim-dependent death may be triggered by loss of IL-7/IL-7R signaling. Finally, we observed parallels in molecular signatures between deletion and anergy, suggesting that these tolerance pathways may not be as molecularly distinct as previously surmised.


Figures

Figure 1
Figure 1
A microarray approach to the analysis of peripheral deletion of CD8+ T cells. (A) Three forms of CD8+ T-cell fate were chosen for microarray comparison of gene expression profiles: deletional tolerance, immunity, and lymphopenia-induced proliferation. In deletional tolerance (left panels), naive T cells (top, round cell) proliferate in response to antigen presented by DCs (top, irregular cell). However, the responding T cells fail to acquire effector functions, and all eventually die by apoptosis (ie, the population contracts). In immunity (middle panels), naive T cells proliferate in response to antigen presented by DCs. In contrast to deletional tolerance, these cells acquire effector functions and, although most cells contract/die at the completion of the CTL immune response, some persist as memory cells. During lymphopenia-induced proliferation (right panels), T cells proliferate in response to homeostatic cytokines and low-avidity TCR/self-major histocompatibility complex interactions with DCs and the responding cells acquire a “memory” phenotype. There is no net loss of cells during this response and hence no contraction and relatively little cell death. (B) Presort and postsort profiles. A total of 2 × 10⁶ CFSE-labeled Ly5.1+ OT-I cells were injected intravenously into antigen-free C57BL/6 (B6), RIP-OVAhi, OCS/LPS-treated C57BL/6 (OCS/LPS), or Rag−/− mice. The cells were then stained for CD8 and Ly5.1, and the viable, CD8+Ly5.1+ cells that had either not divided (B6) or had undergone 2 or more divisions (RIP-OVAhi, OCS/LPS, and Rag−/−) were sorted by FACS. (Top panels) The CFSE profiles of viable, CD8+Ly5.1+ cells presort. (Bottom panels) The same cells postsort. The dotted rectangle represents the sort gate. Representative profiles from 1 of 2 sorts are shown.
Figure 2
Figure 2
Differential expression of probe sets during deletional tolerance, immunity, and lymphopenia-induced proliferation. The Venn diagram depicts the differentially expressed probe sets detected on the array using the statistical analysis described in “Microarray data analysis” in “Methods.” The expression changes are split into probe sets up-regulated (+, left) and down-regulated (−, right) within each comparison. Tol.Naive represents probe sets differentially expressed within OT-I cells isolated from RIP-OVAhi mice relative to the undivided cells recovered from unchallenged (naive) C57BL/6 mice. Imm.Naive and Rag.Naive show the same comparison for cells recovered from OCS/LPS and Rag−/− mice, respectively.
Figure 3
Figure 3
OT-I cells undergoing deletion fail to up-regulate GzmB and Ly6C. A total of 2 × 10⁶ Ly5.1+ CFSE labeled OT-I cells were injected intravenously into either RIP-OVAhi mice or OCS/LPS primed C57BL/6 mice (OCS/LPS). Sixty hours after transfer, the proliferating cells within the sacral and pancreatic lymph nodes (RIP-OVAhi) or spleen (OCS/LPS) were stained and analyzed by flow cytometry. (A) Dot plots of intracellular GzmB staining versus CFSE staining showing unstained (background; left panels) and GzmB-stained (right panels) cells. The plots are gated on CD8+Ly5.1+ T cells. Representative plots from 5 independent experiments (each performed with 3 mice per group) are shown. (B) Data for Ly6C staining plotted similarly to panel A. Representative plots from 3 independent experiments (each performed with 3 mice per group) are shown.
Figure 4
Figure 4
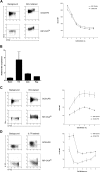
Bcl-2, IL-7Rα chain, and Bim levels during deletion and immunity. A total of 2 × 10⁶ CFSE-labeled OT-I cells were injected intravenously into either RIP-OVAhi mice or OCS/LPS primed C57BL/6 mice (OCS/LPS). Sixty hours after transfer, the proliferating cells within the sacral and pancreatic lymph nodes (RIP-OVAhi) or spleen (OCS/LPS) were stained and analyzed by flow cytometry. (A) Intracellular Bcl-2 staining showing dot plots (left) and quantitated mean fluorescence intensity (MFI; right). MFI graph shows Bcl-2 MFI values minus background, which was determined independently for each cell division. Error bars represent SEM. Representative data are shown from 1 of 3 independent experiments, with 3 mice per group per experiment. (B) Bim real-time PCR performed on array cRNA. The bar graphs show changes in gene expression relative to naive and represent mean data ± SEM from the duplicate array samples (with the exception of the Rag sample, for which only a single replicate was analyzed). Naive indicates naive cells; Tol, cells undergoing deletion; Imm, primed cells; and Rag, cells undergoing lymphopenia-induced proliferation. (C) Same as in panel A, except that cells were stained intracellularly for Bim. Representative data are shown from 1 of 2 independent experiments, with 3 mice per group per experiment. (D) Same as in panel A, except that cells were surface stained for IL-7Rα chain. Representative data are shown from 1 of 3 independent experiments, with 3 mice per group per experiment.
Figure 5
Figure 5
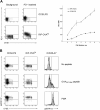
PD-1 levels and ERK1/2 activation during deletion and immunity. A total of 2 × 10⁶ CFSE-labeled OT-I cells were injected intravenously into either RIP-OVAhi mice or OCS/LPS primed B6 mice (OCS/LPS). Sixty hours after transfer, the proliferating cells within the sacral and pancreatic lymph nodes (RIP-OVAhi) or spleen (OCS/LPS) were stained and analyzed by flow cytometry. (A) PD-1 staining showing dot plots (left) and quantitated mean fluorescence intensity (MFI; right). MFI graph shows PD-1 MFI values minus background, which was determined independently for each cell division. Error bars represent SEM. Representative data are shown from 1 of 3 independent experiments, with 3 mice per group per experiment. (B) Levels of activated (ie, phosphorylated) ERK (ppERK1/2) on in vitro peptide restimulation of T cells during immunity and deletion. Cell suspensions were either left unstimulated or restimulated with OVA257-264 peptide or PMA. Cells were then fixed, permeabilized, and stained intracellularly for ppERK1/2. Dot plots are shown for all conditions (left panels), and histograms showing ppERK1/2 levels on divided OT-I cells during both immunity (open histograms) and deletion (gray shaded histograms) are included (right panels). Representative data are shown from 1 of 2 independent experiments, with 3 mice per group per experiment.

References

    1. Redmond WL, Sherman LA. Peripheral tolerance of CD8 T lymphocytes. Immunity. 2005;22:275–284. - PubMed
    1. Davey GM, Kurts C, Miller JF, et al. Peripheral deletion of autoreactive CD8 T cells by cross presentation of self-antigen occurs by a Bcl-2-inhibitable pathway mediated by Bim. J Exp Med. 2002;196:947–955. - PMC - PubMed
    1. Schwartz RH. T cell anergy. Annu Rev Immunol. 2003;21:305–334. - PubMed
    1. Rocha B, Grandien A, Freitas AA. Anergy and exhaustion are independent mechanisms of peripheral T cell tolerance. J Exp Med. 1995;181:993–1003. - PMC - PubMed
    1. Redmond WL, Marincek BC, Sherman LA. Distinct requirements for deletion versus anergy during CD8 T cell peripheral tolerance in vivo. J Immunol. 2005;174:2046–2053. - PubMed

Publication types

MeSH terms