

Structure of the AML1-ETO eTAFH domain-HEB peptide complex and its contribution to AML1-ETO activity
- PMID: 19204326
- PMCID: PMC2668852
- DOI: 10.1182/blood-2008-06-161307
Structure of the AML1-ETO eTAFH domain-HEB peptide complex and its contribution to AML1-ETO activity
Abstract
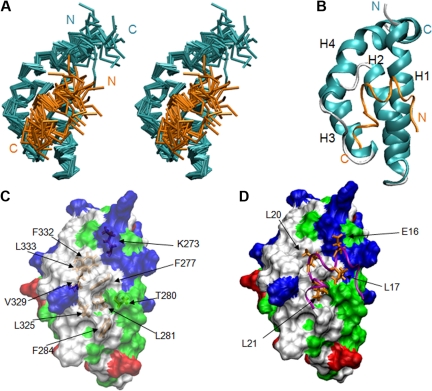
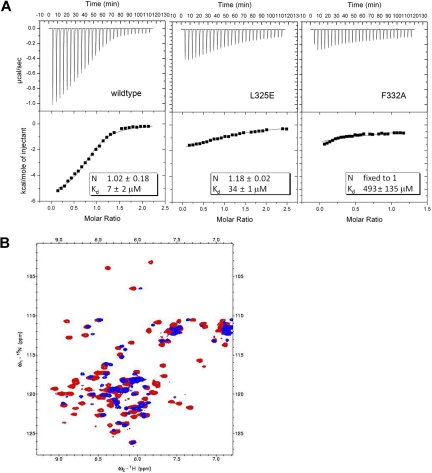
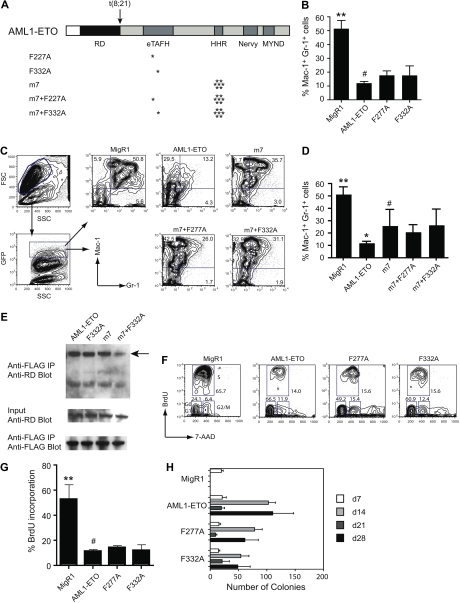
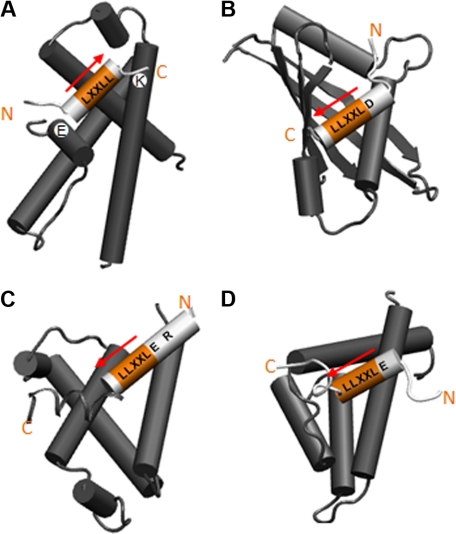
AML1-ETO is the chimeric protein product of the t(8;21) in acute myeloid leukemia. The ETO portion of the fusion protein includes the eTAFH domain, which is homologous to several TATA binding protein-associated factors (TAFs) and interacts with E proteins (E2A and HEB). It has been proposed that AML1-ETO-mediated silencing of E protein function might be important for t(8;21) leukemogenesis. Here, we determined the solution structure of a complex between the AML1-ETO eTAFH domain and an interacting peptide from HEB. On the basis of the structure, key residues in AML1-ETO for HEB association were mutated. These mutations do not impair the ability of AML1-ETO to enhance the clonogenic capacity of primary mouse bone marrow cells and do not eliminate its ability to repress proliferation or granulocyte differentiation. Therefore, the eTAFH-E protein interaction appears to contribute relatively little to the activity of AML1-ETO.
Figures
Similar articles
-
Structure of the AML1-ETO NHR3-PKA(RIIα) complex and its contribution to AML1-ETO activity.J Mol Biol. 2010 Sep 24;402(3):560-77. doi: 10.1016/j.jmb.2010.08.007. Epub 2010 Aug 11. J Mol Biol. 2010. PMID: 20708017 Free PMC article.
-
ETO, but not leukemogenic fusion protein AML1/ETO, augments RBP-Jkappa/SHARP-mediated repression of notch target genes.Mol Cell Biol. 2008 May;28(10):3502-12. doi: 10.1128/MCB.01966-07. Epub 2008 Mar 10. Mol Cell Biol. 2008. PMID: 18332109 Free PMC article.
-
Different roles of E proteins in t(8;21) leukemia: E2-2 compromises the function of AETFC and negatively regulates leukemogenesis.Proc Natl Acad Sci U S A. 2019 Jan 15;116(3):890-899. doi: 10.1073/pnas.1809327116. Epub 2018 Dec 28. Proc Natl Acad Sci U S A. 2019. PMID: 30593567 Free PMC article.
-
Molecular targeting of aberrant transcription factors in leukemia: strategies for RUNX1/ETO.Curr Drug Targets. 2010 Sep;11(9):1181-91. doi: 10.2174/138945010792006744. Curr Drug Targets. 2010. PMID: 20583973 Review.
-
AML1 and the AML1-ETO fusion protein in the pathogenesis of t(8;21) AML.Oncogene. 2001 Sep 10;20(40):5660-79. doi: 10.1038/sj.onc.1204593. Oncogene. 2001. PMID: 11607817 Review. No abstract available.
Cited by
-
The CDK7 inhibitor THZ1 alters RNA polymerase dynamics at the 5' and 3' ends of genes.Nucleic Acids Res. 2019 May 7;47(8):3921-3936. doi: 10.1093/nar/gkz127. Nucleic Acids Res. 2019. PMID: 30805632 Free PMC article.
-
A multi-omic single-cell landscape reveals transcription and epigenetic regulatory features of t(8;21) AML.J Transl Med. 2025 Jul 24;23(1):816. doi: 10.1186/s12967-025-06659-0. J Transl Med. 2025. PMID: 40707954 Free PMC article.
-
t(8;21)AML patients with RUNX1e6::RUNX1T19a splice variant have poor prognosis.Ann Hematol. 2025 Aug;104(8):4081-4091. doi: 10.1007/s00277-025-06545-1. Epub 2025 Aug 11. Ann Hematol. 2025. PMID: 40784929 No abstract available.
-
t(15;21) translocations leading to the concurrent downregulation of RUNX1 and its transcription factor partner genes SIN3A and TCF12 in myeloid disorders.Mol Cancer. 2015 Dec 16;14:211. doi: 10.1186/s12943-015-0484-0. Mol Cancer. 2015. PMID: 26671595 Free PMC article.
-
A tool compound targeting the core binding factor Runt domain to disrupt binding to CBFβ in leukemic cells.Leuk Lymphoma. 2018 Sep;59(9):2188-2200. doi: 10.1080/10428194.2017.1410882. Epub 2017 Dec 18. Leuk Lymphoma. 2018. PMID: 29249175 Free PMC article.
References
-
- Hug BA, Lazar MA. ETO interacting proteins. Oncogene. 2004;23:4270–4274. - PubMed
-
- Davis JN, McGhee L, Meyers S. The ETO (MTG8) gene family. Gene. 2003;303:1–10. - PubMed
-
- Fukuyama T, Sueoka E, Sugio Y, et al. MTG8 proto-oncoprotein interacts with the regulatory subunit of type II cyclic AMP-dependent protein kinase in lymphocytes. Oncogene. 2001;20:6225–6232. - PubMed
-
- Zhang J, Kalkum M, Yamamura S, Chait BT, Roeder RG. E protein silencing by the leukemogenic AML1-ETO fusion protein. Science. 2004;305:1286–1289. - PubMed
Publication types
MeSH terms
Substances
Grants and funding
LinkOut - more resources
Full Text Sources
Medical
Molecular Biology Databases
