. 2009 Apr;181(4):1219-28.
doi: 10.1534/genetics.108.099283. Epub 2009 Feb 9.

Germline expression influences operon organization in the Caenorhabditis elegans genome

Affiliations

Germline expression influences operon organization in the Caenorhabditis elegans genome

Valerie Reinke et al. Genetics. 2009 Apr.

Abstract

Operons are found across multiple kingdoms and phyla, from prokaryotes to chordates. In the nematode Caenorhabditis elegans, the genome contains >1000 operons that compose approximately 15% of the protein-coding genes. However, determination of the force(s) promoting the origin and maintenance of operons in C. elegans has proved elusive. Compared to bacterial operons, genes within a C. elegans operon often show poor coexpression and only sometimes encode proteins with related functions. Using analysis of microarray and large-scale in situ hybridization data, we demonstrate that almost all operon-encoded genes are expressed in germline tissue. However, genes expressed during spermatogenesis are excluded from operons. Operons group together along chromosomes in local clusters that also contain monocistronic germline-expressed genes. Additionally, germline expression of genes in operons is largely independent of the molecular function of the encoded proteins. These analyses demonstrate that mechanisms governing germline gene expression influence operon origination and/or maintenance. Thus, gene expression in a specific tissue can have profound effects on the evolution of genome organization.


Figures

F<sc>igure</sc> 1.—
Figure 1.—
Operons comprise germline-expressed genes. (A) Operon genes are expressed preferentially in the germline, but not during spermatogenesis. Per-chromosome hypergeometric probability test: **P < 0.001 (either over- or underrepresented). Numbers listed at the bottom represent gene number in each category. (B) Nearly all genes within operons are expressed in the germline (1887 of 1988 genes with expression data). (C) Ninety percent of operons have all of their constituent genes expressed in the germline (455 of 510 operons with expression data for all gene members).
F<sc>igure</sc> 2.—
Figure 2.—
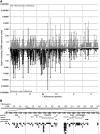
Operons and monocistronic germline-enriched genes cluster along chromosomes. (A) False-discovery rate q-values for clustering of operons within nonoverlapping 100-kb intervals across the genome. Per-chromosome calibration (top half) assesses clustering given operon densities specific to each chromosome; genomewide calibration (bottom half) uses the genomic average proportion of genes that occur in operons. Horizontal dotted lines demarcate the q = 0.05 threshold, with smaller q-values indicating significant clustering in a given interval. Counts of significant clusters are summarized in Table 1. (B) An example of operons clustering with genes with germline-enriched expression along a ∼200-kb region of chromosome I is shown, using the Genome Browser at WormBase (http://www.wormbase.org). Genes marked germline and spermatogenesis are defined from the microarray experiments only. This cluster of operons is somewhat unusual in that two spermatogenesis genes are present in operons. Additional examples from each chromosome are shown in supplemental Figure 2.
F<sc>igure</sc> 3.—
Figure 3.—
Operon density correlates with the density of germline monocistronic genes. For nonoverlapping 100-kb intervals across the genome, the fraction of genes in each interval that occur in operons (operon density) is plotted against the fraction of genes that are both monocistronic and exhibit germline-enriched expression (density of germline-expressed monocistronic genes), on the basis of microarray expression data (Spearman's ρ = 0.35, P < 0.0001). The positive correlation indicates that genomic regions that have a high density of operons also tend to have a high density of germline-expressed monocistronic genes.
F<sc>igure</sc> 4.—
Figure 4.—
Operons are biased for germline expression independent of protein function. The chromosomal distribution of gene sets defined by GO category (metabolism, cytoskeleton, transport) or by tissue-specific gene expression profiling (intestine, neuron, germline) was examined. Although all categories except the germline have as many genes on the X as expected, they are underrepresented for operons on the X, which is not expected if their protein function drives operon formation and/or maintenance.

Similar articles

Cited by

References

    1. Barrière, A., and M.-A. Félix, 2007. Temporal dynamics and linkage disequilibrium in natural Caenorhabditis elegans populations. Genetics 176 999–1011. - PMC - PubMed
    1. Blumenthal, T., D. Evans, C. D. Link, A. Guffanti, D. Lawson et al., 2002. A global analysis of Caenorhabditis elegans operons. Nature 417 851–854. - PubMed
    1. Blumenthal, T., and K. S. Gleason, 2003. Caenorhabditis elegans operons: form and function. Nat. Rev. Genet. 4 110–118. - PubMed
    1. Blumenthal, T., and K. Steward, 1997. RNA processing and gene structure, pp. 117–145 in C. elegans II, edited by D. L. Riddle, T. Blumenthal, B. J. Meyer and J. R. Priess. Cold Spring Harbor Laboratory Press, Plainview, NY. - PubMed
    1. Caron, H., B. Van Schaik, M. Van Der Mee, F. Baas, G. Riggins et al., 2001. The human transcriptome map: clustering of highly expressed genes in chromosomal domains. Science 291 1289–1292. - PubMed

Publication types