

Review
doi: 10.1038/nrg2522.
Nucleosome positioning and gene regulation: advances through genomics
Affiliations
- PMID: 19204718
- PMCID: PMC4860946
- DOI: 10.1038/nrg2522
Item in Clipboard
Review
Nucleosome positioning and gene regulation: advances through genomics
Nat Rev Genet.
2009 Mar.
Abstract
Knowing the precise locations of nucleosomes in a genome is key to understanding how genes are regulated. Recent 'next generation' ChIP-chip and ChIP-Seq technologies have accelerated our understanding of the basic principles of chromatin organization. Here we discuss what high-resolution genome-wide maps of nucleosome positions have taught us about how nucleosome positioning demarcates promoter regions and transcriptional start sites, and how the composition and structure of promoter nucleosomes facilitate or inhibit transcription. A detailed picture is starting to emerge of how diverse factors, including underlying DNA sequences and chromatin remodelling complexes, influence nucleosome positioning.
Figures
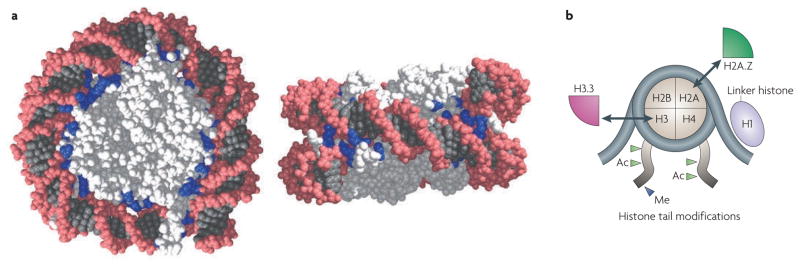
a | Structure of a nucleosome core particle (front and side view),. Histones are shown in light grey, and the DNA helix is shown in dark grey with a pink backbone. Basic amino acids (lysine and arginine) within 7 Å of the DNA are shown in blue to emphasize the electrostatic contacts between the DNA phosphates and the histones. b | A schematic of DNA wrapped around a nucleosome. Examples of histone tail modifications (Ac, acetylation; Me, methylation) and histone variants (H2A.Z and H3.3) are shown. Arrows indicate the replacement of canonical histones with histone variants. Part a courtesy of S. Tan, Pennsylvania State University, USA.
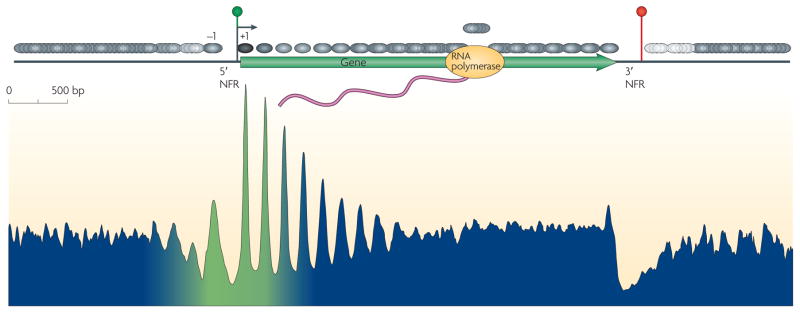
The consensus distribution of nucleosomes (grey ovals) around all yeast genes is shown, aligned by the beginning and end of every gene. The resulting two plots were fused in the genic region. The peaks and valleys represent similar positioning relative to the transcription start site (TSS). The arrow under the green circle near the 5′ nucleosome-free region (NFR) represents the TSS. The green –blue shading in the plot represents the transitions observed in nucleosome composition and phasing (green represents high H2A.Z levels, acetylation, H3K4 methylation and phasing, whereas blue represents low levels of these modifications). The red circle indicates transcriptional termination within the 3′ NFR. Figure is reproduced, with permission, from REF. © (2008) Cold Spring Harbor Laboratory Press.

a | In a population, individual nucleosomes are either positioned within a small range of a genomic locus (phased) or with a continuous distribution throughout an array (fuzzy). b | The bar graph is an idealized distribution of nucleosomal sequence tags, which form a large cluster and several subclusters, in which the subclusters are spaced about 10 bp apart and represent multiple translational settings with a single predominant rotational setting (see also BOX 1). Also shown is a schematic of alternative rotational settings of DNA and its effect on site accessibility (indicated by the black ‘rungs’ on the DNA helix).

a | Individual slots represent nucleosome positioning sequences that define where a nucleosome (grey circle) will reside on a length of DNA. b | In its purest form, statistical positioning relies on a single positional barrier (left side), against which nucleosomes are ordered. A probabilistic density trace of where nucleosomes would reside in a population is shown. c | The true cellular state is likely to be a combination of both independent and statistical positioning.

A current model of how nucleosomes might direct start site selection in yeast, compared with metazoans is shown. Each step is also described in the main text. In step 1, the acetylation marks are recognized by bromodomain modules, which are found in many chromatin regulatory complexes, including the SAGA histone acetyltransferase complex and TFIID. In step 2, SAGA and TFIID then deliver TATA binding protein (TBP) to promoters. In step 3, TBP binds TFIIB and places it immediately downstream towards the transcription start site (TSS). In step 4, TFIIB positions RNA polymerase II (Pol II) at the promoter. The diagram for metazoans is a simplified version of that shown for yeast, in which the relationship between Pol II and the initiator (INR) is emphasized. The dashed arrows in both panels indicate sliding of Pol II before transcription initiation. Acetylation marks are indicated by green stars. The green colouring represents H2A.Z enrichment in the nucleosome array.

a | A stable nucleosome. b | A remodelled nucleosome. c | An evicted nucleosome. Three transcription factor binding sites are shown in red, green and blue, respectively. The red and blue sites become accessible only during remodelling, either by nucleosome sliding, as indicated by the arrows in a, or by chromatin remodelling complexes (for example, ISW2, SWR1 and SWI/SNF) that ‘extract’ DNA from the nucleosome surface, as shown in b. Owing to rotational phasing, the green site is always accessible in the various states. Nucleosome eviction (c) might be necessary to assemble a pre-initiation complex and to transcribe the underlying DNA. Anti-silencing function 1 (Asf1) and H2A.Z-specific chaperone (Chz1) are examples of histone chaperones. Ac, acetylation.
References
-
- Kornberg RD, Klug A. The nucleosome. Sci Am. 1981;244:52–64. - PubMed
-
- Luger K, Mader AW, Richmond RK, Sargent DF, Richmond TJ. Crystal structure of the nucleosome core particle at 2.8 Å resolution. Nature. 1997;389:251–260. - PubMed
-
- Kamakaka RT, Biggins S. Histone variants: deviants? Genes Dev. 2005;19:295–310. - PubMed
-
- Sarma K, Reinberg D. Histone variants meet their match. Nature Rev Mol Cell Biol. 2005;6:139–149. - PubMed
-
- Lee CK, Shibata Y, Rao B, Strahl BD, Lieb JD. Evidence for nucleosome depletion at active regulatory regions genome-wide. Nature Genet. 2004;36:900–905. - PubMed
Publication types
MeSH terms
Substances
Grants and funding
LinkOut - more resources
Full Text Sources
Other Literature Sources
Molecular Biology Databases
