. 2009 Mar 26;458(7237):524-8.
doi: 10.1038/nature07713. Epub 2009 Feb 8.

Sphingosine-1-phosphate mobilizes osteoclast precursors and regulates bone homeostasis

Affiliations

Sphingosine-1-phosphate mobilizes osteoclast precursors and regulates bone homeostasis

Masaru Ishii et al. Nature. .

Erratum in

  • Nature. 2010 Jun 17;465(7300):966

Abstract

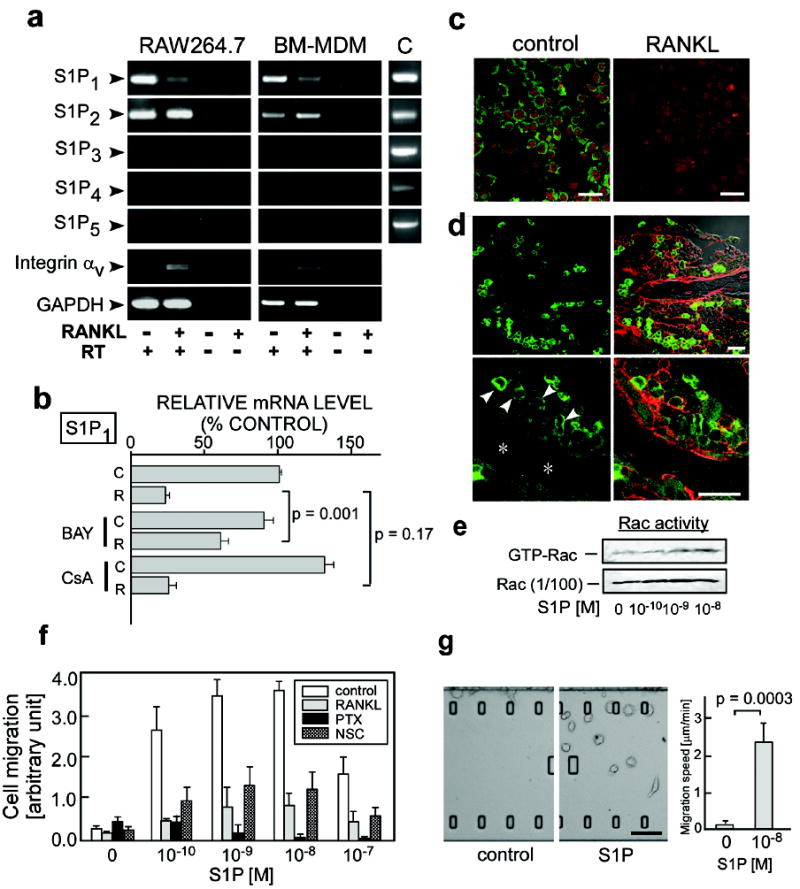
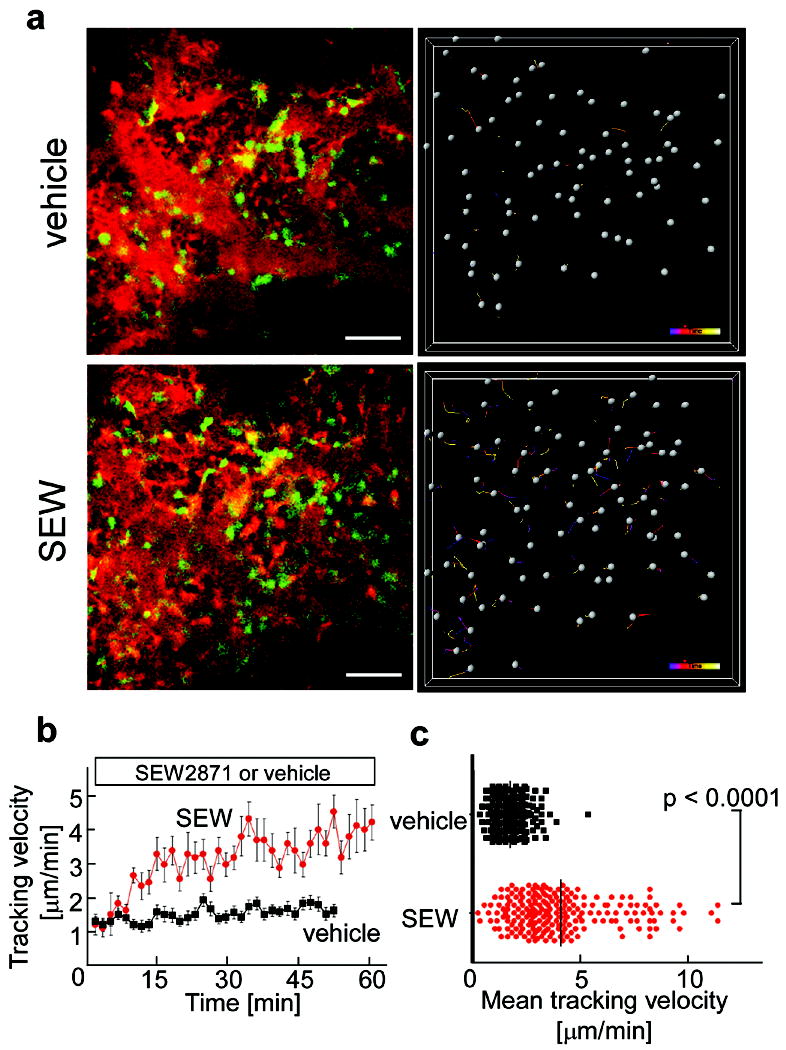
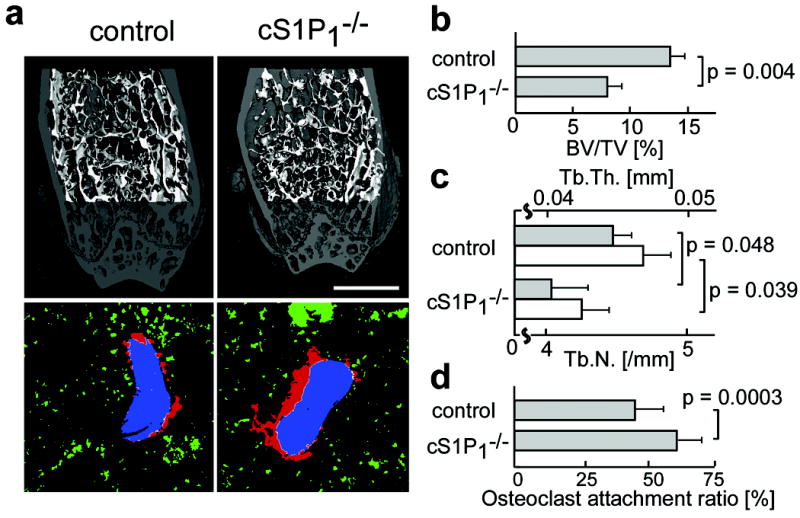
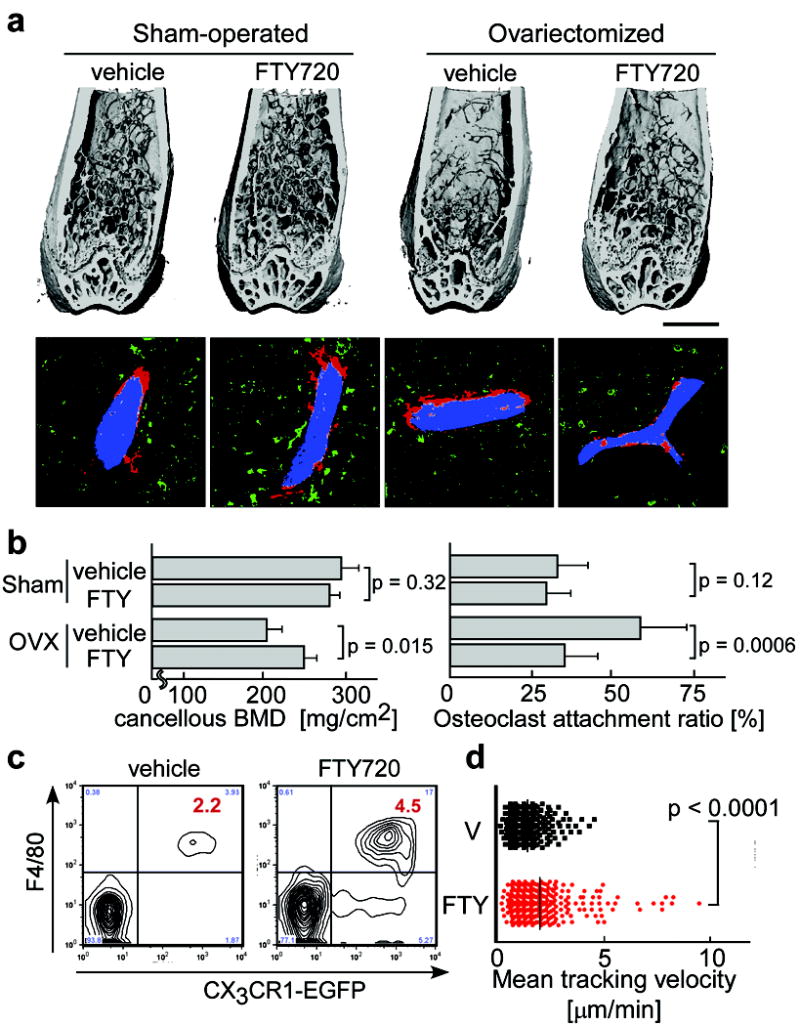
Osteoclasts are the only somatic cells with bone-resorbing capacity and, as such, they have a critical role not only in normal bone homeostasis (called 'bone remodelling') but also in the pathogenesis of bone destructive disorders such as rheumatoid arthritis and osteoporosis. A major focus of research in the field has been on gene regulation by osteoclastogenic cytokines such as receptor activator of NF-kappaB-ligand (RANKL, also known as TNFSF11) and TNF-alpha, both of which have been well documented to contribute to osteoclast terminal differentiation. A crucial process that has been less well studied is the trafficking of osteoclast precursors to and from the bone surface, where they undergo cell fusion to form the fully differentiated multinucleated cells that mediate bone resorption. Here we report that sphingosine-1-phosphate (S1P), a lipid mediator enriched in blood, induces chemotaxis and regulates the migration of osteoclast precursors not only in culture but also in vivo, contributing to the dynamic control of bone mineral homeostasis. Cells with the properties of osteoclast precursors express functional S1P(1) receptors and exhibit positive chemotaxis along an S1P gradient in vitro. Intravital two-photon imaging of bone tissues showed that a potent S1P(1) agonist, SEW2871, stimulated motility of osteoclast precursor-containing monocytoid populations in vivo. Osteoclast/monocyte (CD11b, also known as ITGAM) lineage-specific conditional S1P(1) knockout mice showed osteoporotic changes due to increased osteoclast attachment to the bone surface. Furthermore, treatment with the S1P(1) agonist FTY720 relieved ovariectomy-induced osteoporosis in mice by reducing the number of mature osteoclasts attached to the bone surface. Together, these data provide evidence that S1P controls the migratory behaviour of osteoclast precursors, dynamically regulating bone mineral homeostasis, and identifies a critical control point in osteoclastogenesis that may have potential as a therapeutic target.


Figures

Figure 1
Figure 1. Expression and function of S1P receptors in osteoclast precursor monocytes
a, Expression of mRNAs encoding 5 mammalian S1P receptors (S1P1 to S1P5) in RAW264.7 monocytes (left panels) and in mouse bone marrow-derived, M-CSF-dependent monocytes (BM-MDM) (middle panels), detected by RT-PCR. mRNAs for integrin αv and GAPDH were also analyzed as controls. Total cDNA isolated from mouse thymus was used for positive controls (C, right panels). RT, reverse transcription. b, Quantitative real-time RT-PCR analysis of S1P1 mRNA expressed in RAW264.7 cells cultured in the absence (C) or presence (R) of RANKL. Cells were treated with BAY11-7085 (BAY; 10 μM) or cyclosporine A (CyA; 1 μM). Error bars represent ± SEM. c, Immunofluorescent detection of S1P1 protein (green) in RAW264.7 cells cultured in the absence (left panel) or presence (right panel) of 50 ng/ml RANKL. Nuclei were visualized with propidium iodide (red). Scale bars represent 20 μm. d, Immunohistochemical analysis of S1P1 in mouse femoral bone tissues at low (upper) and high (lower) magnification. Staining for S1P1 (green) (left two panels); merged image with staining for CD9 (red) and transmission (Nomarski image) (right two panels). Arrowheads represent S1P1high mononuclear cells adjacent to bone trabeculae (asterisk). Scale bars represent 20 μm. e, S1P-induced Rac stimulation. RAW264.7 cells were treated with various concentrations of S1P for 15 min and then analysed for GTP-Rac. f, In vitro chemotactic response of RAW264.7 to S1P gradient. Error bars represent SEM (n = 6). g, In vitro S1P-directed chemotaxis of RAW264.7 dynamically visualized using EZ-Taxiscan™. Cells were loaded onto the upper chamber and the lower chamber was filled either with normal medium (right panel; Supplementary Video 1) or with medium containing 10-8 M S1P (middle panel; Supplementary Video 2). Mean migration speed is shown in right panel. Error bars represent SEM (n = 8). Scale bar represents 100 μm.
Figure 2
Figure 2. In vivo S1P-mediated increase in motility of osteoclast precursor monocytes visualized using intravital two-photon imaging
a, Intravital two- photon imaging of mouse skull bone tissues of heterozygous CX3CR1-EGFP knock-in mice, in the absence (upper panels; Supplementary Video 3) or presence (lower panels; Supplementary Video 4) of the S1P1 agonist SEW2871 (5 mg/kg). CX3CR1-EGFP positive cells appear green. The microvasculature was visualized by intravenous injection of 70kDa dextran-conjugated Texas Red (red) (left panels). The movements of CX3CR1-EGFP positive cells were tracked for 10 minutes (right panels). Gray spheres represent cells and colored lines show the associated trajectories. Scale bars represent 50 μm. b, Quantification of CX3CR1-EGFP positive cell velocity. Tracking velocity over time after application of SEW2871 (red circle) or vehicle only (black square) are shown. Data points represent mean values (± SEM) of cell velocities in the field at certain time points (n = 15 for vehicle and n = 14 for SEW 2871). c, Summary of mean velocity of CX3CR1-EGFP positive cells treated with SEW2871 (red circle) or vehicle (black circle). Data points (n = 231 for vehicle and n = 210 for SEW2871) represent individual cells compiled from 5 independent experiments.
Figure 3
Figure 3. In vivo impact of S1P1 on bone mineral metabolism
a, Morphohistometric analyses of control and cS1P1-/- (S1P1loxP/loxP CD11b-Cre) littermates. Femoral bone samples were analyzed by cone-beam μCT (upper panels) and by histological examination combined with computational quantification for measuring the osteoclast attachment ratio to the bone surface (lower panels) (also see Supplementary Fig. 6 and supplementary material). Blue areas represent bone trabeculae (2nd harmonic fluorescence signal), red and green areas show TRAP-positive osteoclasts that are attached to or detached from bone trabeculae, respectively, and white shows the area of OC/bone attachment. Scale bar (in upper panel) represents 1 mm. b-d, Summary of the data of bone matrix density (bone volume / total volume = BV / TV) (b), trabecular thickness (Tb.Th.) (c, filled bars) and trabecular density (Tb.N.) (c, open bars) calculated from μCT images, and osteoclast attachment ratio calculated by computational segmentation analyses (d). Error bars represent SEM. n = 3 (b, c) and n = 40 (from 3 mice) (d) for each.
Figure 4
Figure 4. Preventive effect of FTY720 on ovariectomy-induced osteoporosis
a, Effect of FTY720 on bone mineral metabolism. Femurs were collected from mice after four different treatments; sham-operated / vehicle treated, sham-operated / FTY720 treated, ovariectomized / vehicle treated and ovariectomized / FTY720 treated. Bone samples were analyzed by cone-beam μCT (upper panels) and by histological examination combined with computational quantification for measuring the osteoclast attachment ratio to the bone surface (lower panels) (see Supplementary Fig. 5). Scale bar (upper panel) represents 1 mm. b, Summary of the data of cancellous bone mineral density calculated from μCT images (left panel) and of osteoclast attachment ratio (right panel). Error bars represent SEM. n = 3 (left panel) and n = 20 (from 3 mice) (right panel) for each. c, Effect of FTY720 on the composition of peripheral mononuclear cells (PMC). PMC collected from CX3CR1-EGFP knock-in mice administered vehicle or FTY720 were stained with anti-F4/80 (Alexa647). Absolute numbers of CX3CR1-EGFP+ F4/80+ cells [/10 ml of peripheral blood] are described in the panels. d, Effect of FTY720 on the mobility of CX3CR1-EGFP marked cells. Summary of mean tracking velocity of CX3CR1-EGFP positive cells treated with FTY720 (red circle) or vehicle (black circle). Data points (n = 246 for vehicle and n = 339 for FTY720) represent individual cells compiled from 4 independent experiments. Intravital two-photon images of mouse skull bone tissues of heterozygous CX3CR1-EGFP knock-in mice treated with FTY720 are shown in Supplementary Video 7.

Similar articles

Cited by

References

    1. Teitelbaum SL. Bone resorption by osteoclasts. Science. 2000;289:1504–1508. - PubMed
    1. Teitelbaum SL, Ross FP. Genetic regulation of osteoclast development and function. Nat Rev Genet. 2003;4:638–649. - PubMed
    1. Karsenty G, Wagner EF. Reaching a genetic and molecular understanding of skeletal development. Dev Cell. 2002;2:389–406. - PubMed
    1. Rosen H, Goetzl EJ. Sphingosine 1-phosphate and its receptors: an autocrine and paracrine network. Nat Rev Immunol. 2005;5:560–570. - PubMed
    1. Cyster JG. Chemokines, sphingosine-1-phosphate, and cell migration in secondary lymphoid organs. Annu Rev Immunol. 2005;23:127–159. - PubMed

Publication types

MeSH terms