

Microarray analyses of gene expression during the Tetrahymena thermophila life cycle
- PMID: 19204800
- PMCID: PMC2636879
- DOI: 10.1371/journal.pone.0004429
Microarray analyses of gene expression during the Tetrahymena thermophila life cycle
Abstract
Background: The model eukaryote, Tetrahymena thermophila, is the first ciliated protozoan whose genome has been sequenced, enabling genome-wide analysis of gene expression.
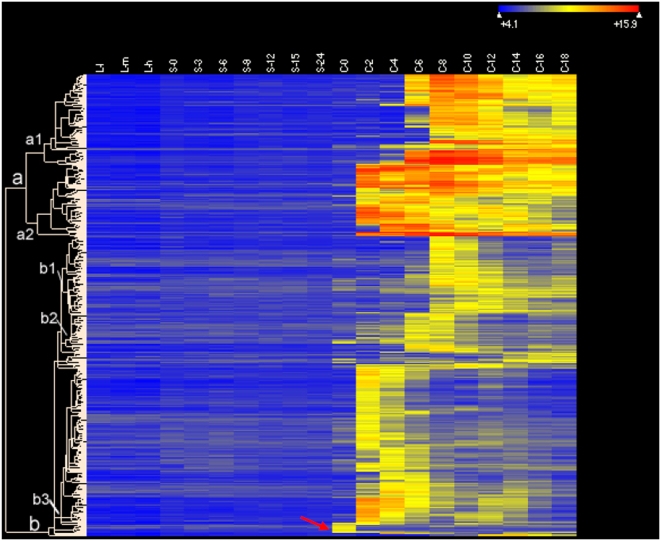
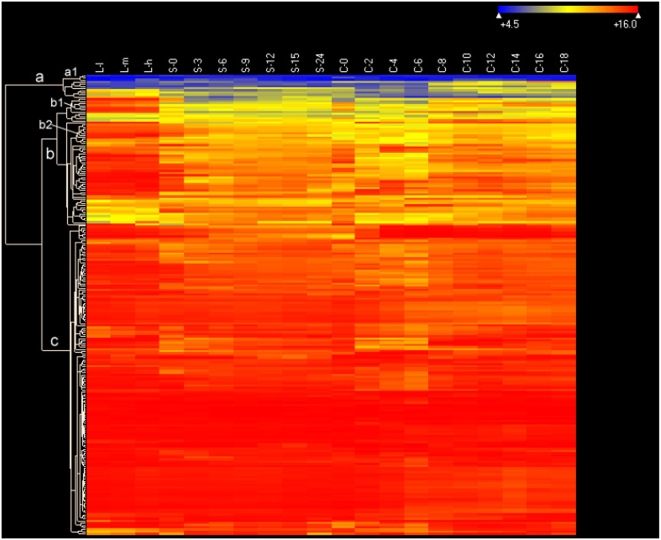
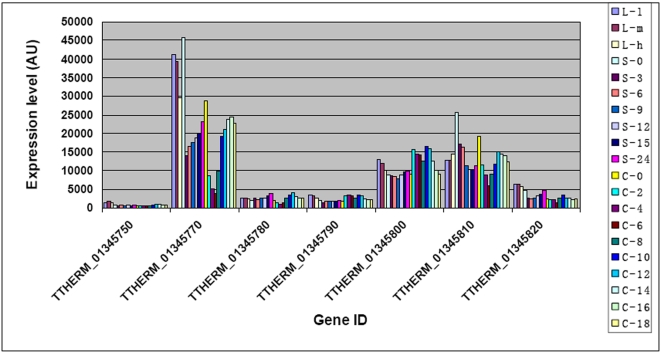
Methodology/principal findings: A genome-wide microarray platform containing the predicted coding sequences (putative genes) for T. thermophila is described, validated and used to study gene expression during the three major stages of the organism's life cycle: growth, starvation and conjugation.
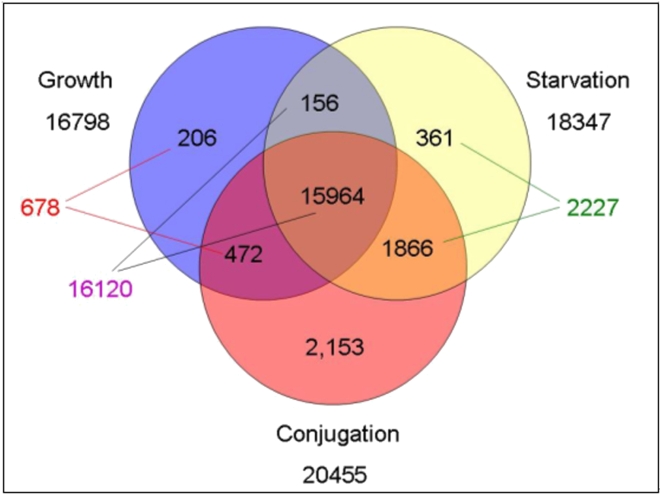
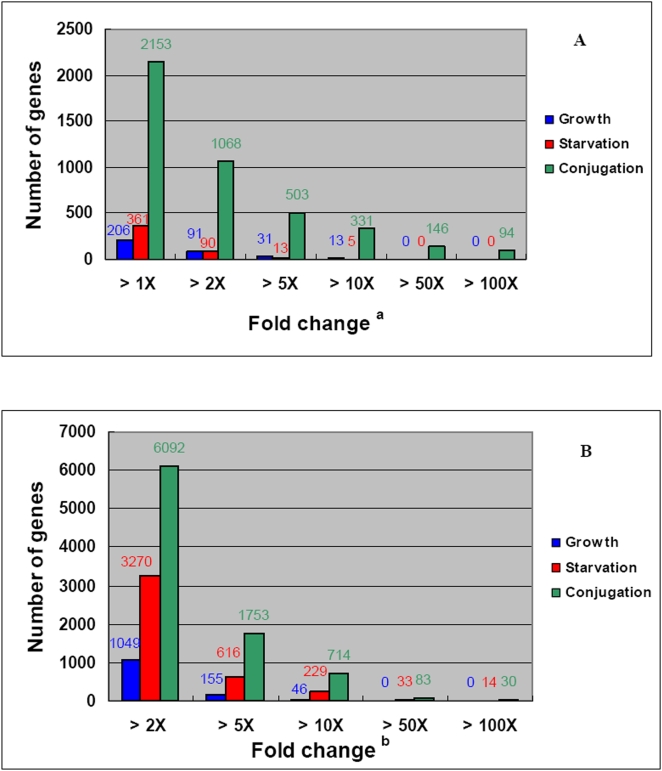
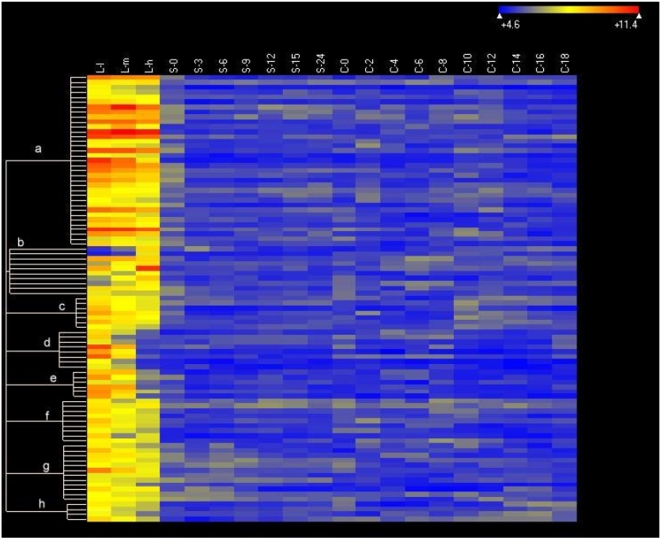
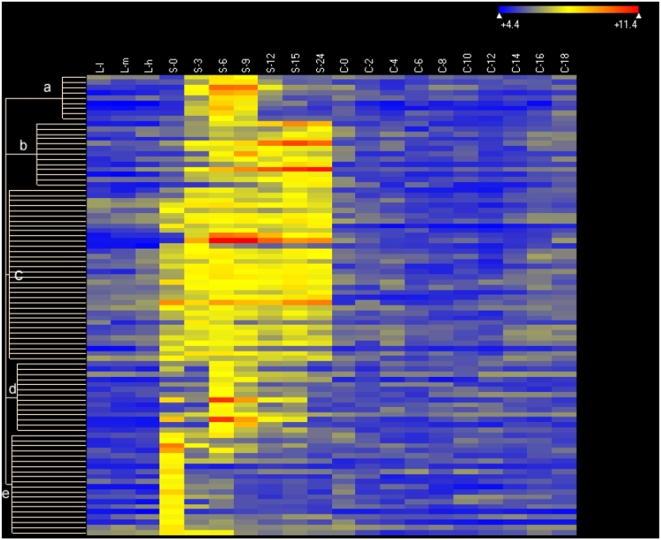
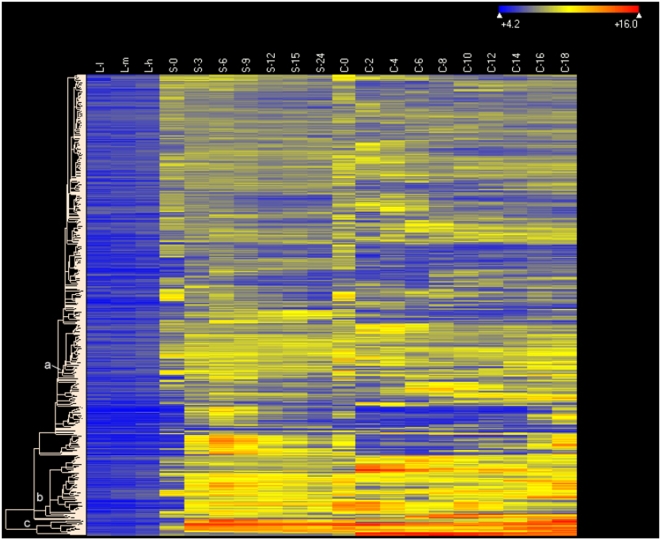
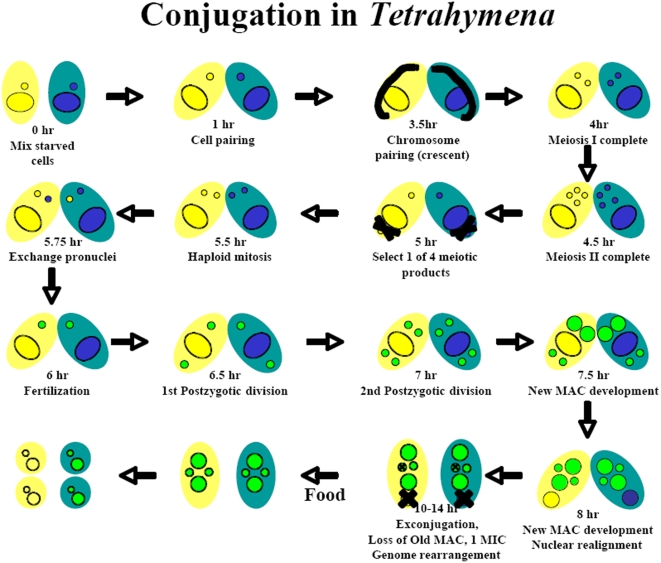
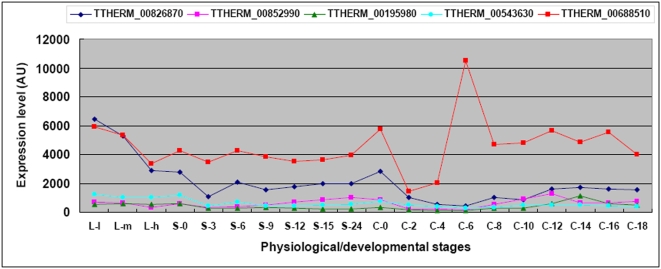
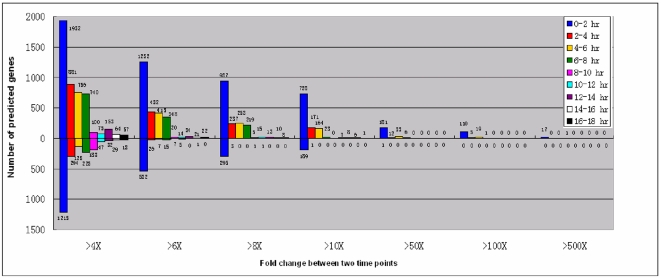
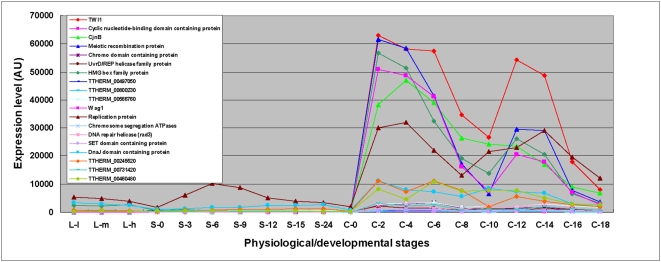
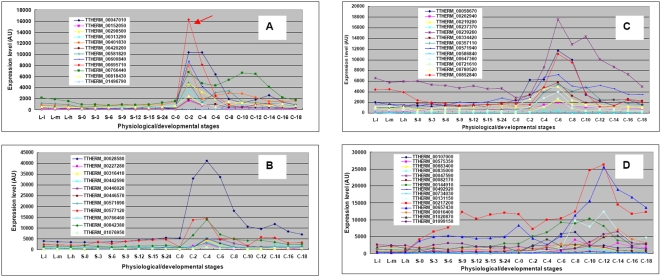
Conclusions/significance: Of the approximately 27,000 predicted open reading frames, transcripts homologous to only approximately 5900 are not detectable in any of these life cycle stages, indicating that this single-celled organism does indeed contain a large number of functional genes. Transcripts from over 5000 predicted genes are expressed at levels >5x corrected background and 95 genes are expressed at >250x corrected background in all stages. Transcripts homologous to 91 predicted genes are specifically expressed and 155 more are highly up-regulated in growing cells, while 90 are specifically expressed and 616 are up-regulated during starvation. Strikingly, transcripts homologous to 1068 predicted genes are specifically expressed and 1753 are significantly up-regulated during conjugation. The patterns of gene expression during conjugation correlate well with the developmental stages of meiosis, nuclear differentiation and DNA elimination. The relationship between gene expression and chromosome fragmentation is analyzed. Genes encoding proteins known to interact or to function in complexes show similar expression patterns, indicating that co-ordinate expression with putative genes of known function can identify genes with related functions. New candidate genes associated with the RNAi-like process of DNA elimination and with meiosis are identified and the late stages of conjugation are shown to be characterized by specific expression of an unexpectedly large and diverse number of genes not involved in nuclear functions.
Conflict of interest statement
Figures
Similar articles
-
Transcriptome analysis of the model protozoan, Tetrahymena thermophila, using Deep RNA sequencing.PLoS One. 2012;7(2):e30630. doi: 10.1371/journal.pone.0030630. Epub 2012 Feb 7. PLoS One. 2012. PMID: 22347391 Free PMC article.
-
[Expression analysis of 5 hsp70 genes in Tetrahymena thermophila].Dongwuxue Yanjiu. 2011 Jun;32(3):267-76. doi: 10.3724/SP.J.1141.2011.03267. Dongwuxue Yanjiu. 2011. PMID: 21698792 Chinese.
-
The piggyBac transposon-derived genes TPB1 and TPB6 mediate essential transposon-like excision during the developmental rearrangement of key genes in Tetrahymena thermophila.Genes Dev. 2016 Dec 15;30(24):2724-2736. doi: 10.1101/gad.290460.116. Genes Dev. 2016. PMID: 28087716 Free PMC article.
-
Small RNAs in genome rearrangement in Tetrahymena.Curr Opin Genet Dev. 2004 Apr;14(2):181-7. doi: 10.1016/j.gde.2004.01.004. Curr Opin Genet Dev. 2004. PMID: 15196465 Review.
-
Developmental progression of Tetrahymena through the cell cycle and conjugation.Methods Cell Biol. 2012;109:177-236. doi: 10.1016/B978-0-12-385967-9.00007-4. Methods Cell Biol. 2012. PMID: 22444146 Review.
Cited by
-
The two human centrin homologues have similar but distinct functions at Tetrahymena basal bodies.Mol Biol Cell. 2012 Dec;23(24):4766-77. doi: 10.1091/mbc.E12-06-0454. Epub 2012 Oct 19. Mol Biol Cell. 2012. PMID: 23087207 Free PMC article.
-
Tetrahymena Glutathione Peroxidase Family: A Comparative Analysis of These Antioxidant Enzymes and Differential Gene Expression to Metals and Oxidizing Agents.Microorganisms. 2020 Jul 5;8(7):1008. doi: 10.3390/microorganisms8071008. Microorganisms. 2020. PMID: 32635666 Free PMC article.
-
Tetrahymena Genome Database Wiki: a community-maintained model organism database.Database (Oxford). 2012 Mar 20;2012:bas007. doi: 10.1093/database/bas007. Print 2012. Database (Oxford). 2012. PMID: 22434841 Free PMC article.
-
Conservation and innovation in Tetrahymena membrane traffic: proteins, lipids, and compartments.Methods Cell Biol. 2012;109:141-75. doi: 10.1016/B978-0-12-385967-9.00006-2. Methods Cell Biol. 2012. PMID: 22444145 Free PMC article. Review.
-
Comparative Transcriptome Analyses during the Vegetative Cell Cycle in the Mono-Cellular Organism Pseudokeronopsis erythrina (Alveolata, Ciliophora).Microorganisms. 2020 Jan 12;8(1):108. doi: 10.3390/microorganisms8010108. Microorganisms. 2020. PMID: 31940957 Free PMC article.
References
-
- Frankel J. Cell biology of Tetrahymena thermophila. Methods Cell Biol. 2000;62:27–125. - PubMed
-
- Blackburn EH, Gall JG. A tandemly repeated sequence at the termini of the extrachromosomal ribosomal RNA genes in Tetrahymena. J Mol Biol. 1978;120:33–53. - PubMed
-
- Kruger K, Grabowski PJ, Zaug AJ, Sands J, Gottschling DE, et al. Self-splicing RNA: autoexcision and autocyclization of the ribosomal RNA intervening sequence of Tetrahymena. Cell. 1982;31:147–157. - PubMed
-
- Greider CW, Blackburn EH. Identification of a specific telomere terminal transferase activity in Tetrahymena extracts. Cell. 1985;43:405–413. - PubMed
Publication types
MeSH terms
Substances
Grants and funding
LinkOut - more resources
Full Text Sources
Molecular Biology Databases
