

Dissection of functional residues in receptor activity-modifying proteins through phylogenetic and statistical analyses
- PMID: 19204815
- PMCID: PMC2614204
- DOI: 10.4137/ebo.s705
Dissection of functional residues in receptor activity-modifying proteins through phylogenetic and statistical analyses
Abstract
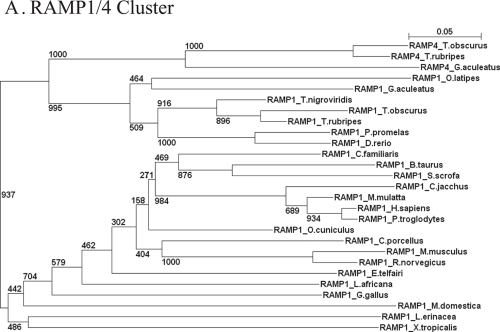
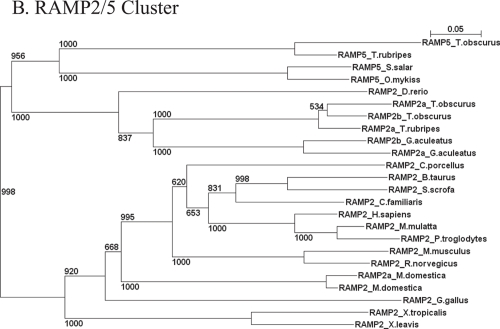
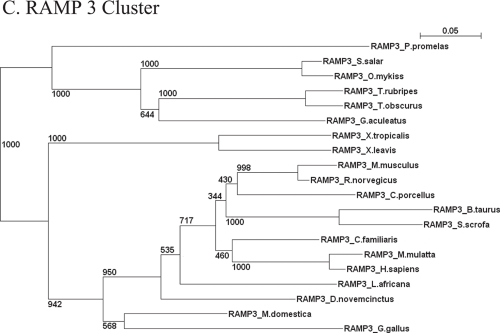
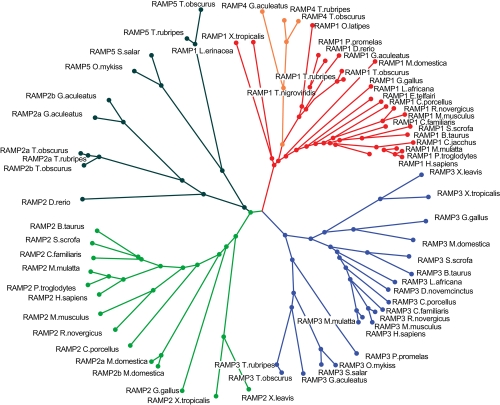
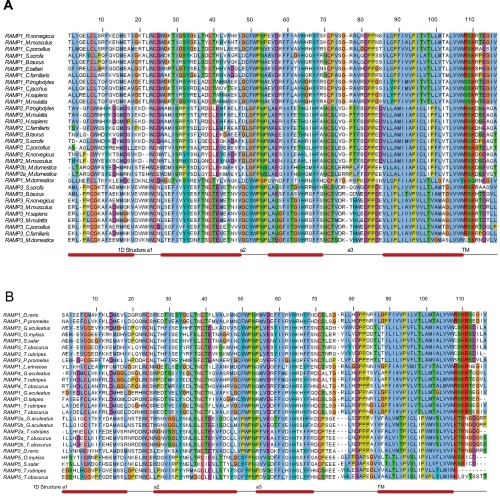
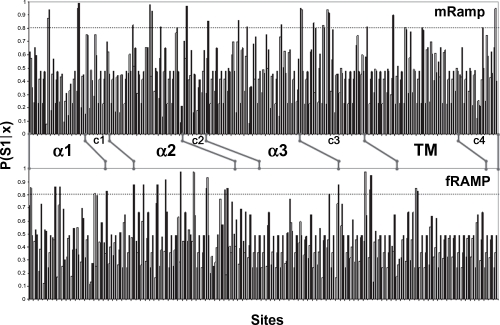
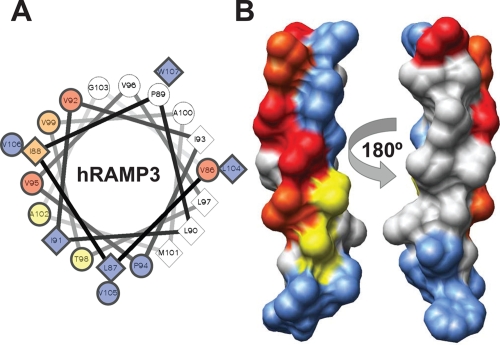
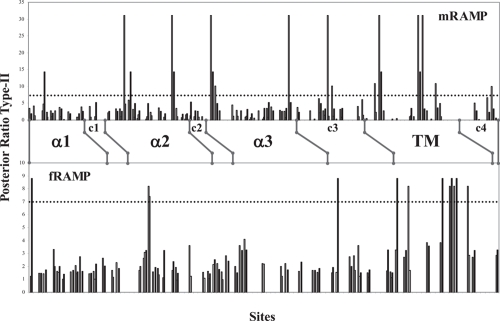
Type I and type-II functional divergences have been stated to highlight specific residues carrying out differential functions in evolutionary-divergent protein clusters from a single common ancestor. Briefly, type I analysis is based on residue constraints reflecting a gain of function just in one cluster of an entire family of proteins; while the type-II approach is based on residue constraints showing a different chemical nature in every cluster of a protein family. This last evidence is understood as differential functionality among clusters. The Receptor Activity-Modifying Proteins constitute a family characterized by its paralogous distribution in vertebrates. They are known as G-Protein Coupled Receptor modulators. Although several studies have determined their involvement in ligand binding, specificity, and enhancement of signal transduction, the responsible residues supporting those functions are unclear. Using different bioinformatic approaches, we predicted residues involved in different RAMP functional tasks. Many residues localized in an extracellular coil of RAMP proteins were predicted to be under functional divergence suggesting a gain of function in their respective proteins. Interestingly, the transmembrane region also showed important results for residues playing relevant roles where most of them showed a biased distribution on the structure. A relevant role was conferred by the enrichment of type-II residues observed in their sequences. We show a collection of residues explaining possible gain of function and differential functionality in RAMP proteins. These residues are still experimentally unexplored with regards to functionality. Finally, an evolutionary history could be discerned. Mainly, the RAMP2 cluster has evolved in a higher manner than other RAMP clusters. However, a deacceleration in the aminoacid substitution rate of RAMP2 was observed in mammals. Such effect could be caused by the co-evolution of ligands and receptors interacting with RAMP2 through evolution and/or the specialization of this cluster in GPCR modulation.
Keywords: evolutionary history; functional divergence; receptor activity-modifying proteins.
Figures
Similar articles
-
An allosteric role for receptor activity-modifying proteins in defining GPCR pharmacology.Cell Discov. 2016 May 17;2:16012. doi: 10.1038/celldisc.2016.12. eCollection 2016. Cell Discov. 2016. PMID: 27462459 Free PMC article.
-
Cloning, characterization and central nervous system distribution of receptor activity modifying proteins in the rat.Eur J Neurosci. 2001 Aug;14(4):618-28. doi: 10.1046/j.0953-816x.2001.01688.x. Eur J Neurosci. 2001. PMID: 11556887
-
The seven amino acids of human RAMP2 (86) and RAMP3 (59) are critical for agonist binding to human adrenomedullin receptors.J Biol Chem. 2001 Dec 28;276(52):49459-65. doi: 10.1074/jbc.M108369200. Epub 2001 Oct 8. J Biol Chem. 2001. PMID: 11591721
-
The expanding repertoire of receptor activity modifying protein (RAMP) function.Crit Rev Biochem Mol Biol. 2016;51(1):65-71. doi: 10.3109/10409238.2015.1128875. Epub 2016 Jan 6. Crit Rev Biochem Mol Biol. 2016. PMID: 26740457 Free PMC article. Review.
-
RAMPs as allosteric modulators of the calcitonin and calcitonin-like class B G protein-coupled receptors.Adv Pharmacol. 2020;88:115-141. doi: 10.1016/bs.apha.2020.01.001. Epub 2020 Jan 27. Adv Pharmacol. 2020. PMID: 32416865 Free PMC article. Review.
Cited by
-
Structure-function relationships of the N-terminus of receptor activity-modifying proteins.Br J Pharmacol. 2010 Mar;159(5):1059-68. doi: 10.1111/j.1476-5381.2009.00541.x. Epub 2009 Dec 10. Br J Pharmacol. 2010. PMID: 20015292 Free PMC article. Review.
-
GPCRs globally coevolved with receptor activity-modifying proteins, RAMPs.Proc Natl Acad Sci U S A. 2017 Nov 7;114(45):12015-12020. doi: 10.1073/pnas.1713074114. Epub 2017 Oct 23. Proc Natl Acad Sci U S A. 2017. PMID: 29078385 Free PMC article.
-
The Calcitonin/Calcitonin Gene-Related Peptide Family in Invertebrate Deuterostomes.Front Endocrinol (Lausanne). 2018 Nov 30;9:695. doi: 10.3389/fendo.2018.00695. eCollection 2018. Front Endocrinol (Lausanne). 2018. PMID: 30555412 Free PMC article. Review.
-
Elucidating the Interactome of G Protein-Coupled Receptors and Receptor Activity-Modifying Proteins.Pharmacol Rev. 2023 Jan;75(1):1-34. doi: 10.1124/pharmrev.120.000180. Epub 2022 Dec 8. Pharmacol Rev. 2023. PMID: 36757898 Free PMC article. Review.
References
-
- Abascal F, Zardoya R, Posada D. ProtTest: Selection of bestfit models of protein evolution. Bioinformatics. 2005;21:2104–5. - PubMed
-
- Altschul SF, Gish W, Miller W, et al. Basic local alignment search tool. J Mol Biol. 1990;215:403–10. - PubMed
-
- Benitez-Paez A. Sequence analysis of the Receptor Activity-Modifying Proteins family, new putative peptides and structural conformation inference. In Silico Biol. 2006;6:476–83. - PubMed
LinkOut - more resources
Full Text Sources
