. 2009 Mar 20;4(3):221-31.
doi: 10.1021/cb800306y.

Slow-onset inhibition of the FabI enoyl reductase from francisella tularensis: residence time and in vivo activity

Affiliations

Slow-onset inhibition of the FabI enoyl reductase from francisella tularensis: residence time and in vivo activity

Hao Lu et al. ACS Chem Biol. .

Abstract

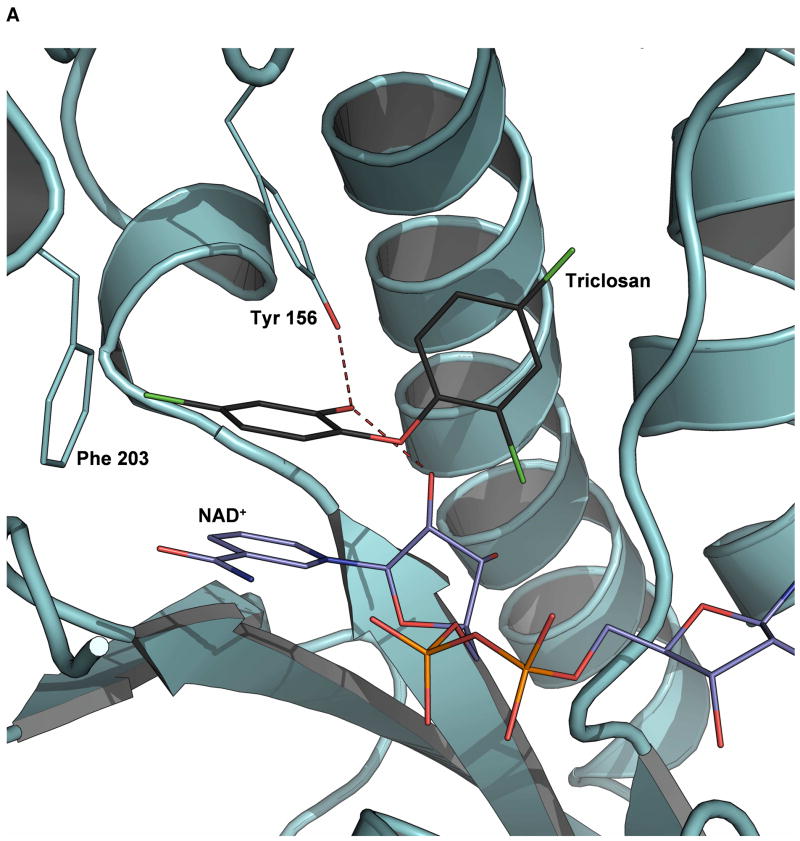
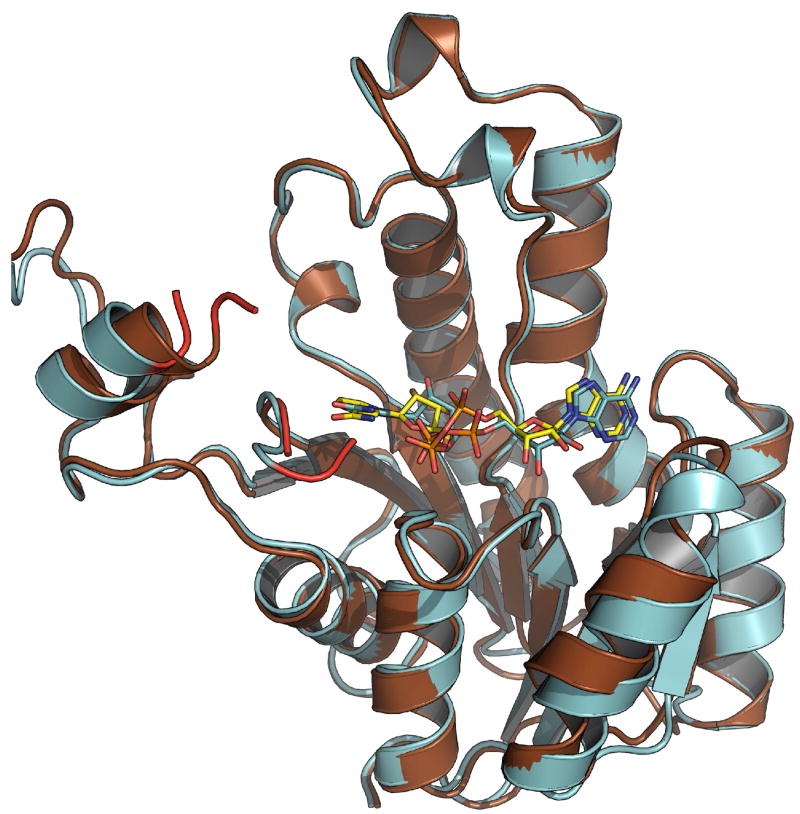
Francisella tularensis is a highly virulent and contagious Gram-negative intracellular bacterium that causes the disease tularemia in mammals. The high infectivity and the ability of the bacterium to survive for weeks in a cool, moist environment have raised the possibility that this organism could be exploited deliberately as a potential biological weapon. Fatty acid biosynthesis (FAS-II) is essential for bacterial viability and has been validated as a target for the discovery of novel antibacterials. The FAS-II enoyl reductase ftuFabI has been cloned and expressed, and a series of diphenyl ethers have been identified that are subnanomolar inhibitors of the enzyme with MIC90 values as low as 0.00018 microg mL(-1). The existence of a linear correlation between the Ki and MIC values strongly suggests that the antibacterial activity of the diphenyl ethers results from direct inhibition of ftuFabI within the cell. The compounds are slow-onset inhibitors of ftuFabI, and the residence time of the inhibitors on the enzyme correlates with their in vivo activity in a mouse model of tularemia infection. Significantly, the rate of breakdown of the enzyme-inhibitor complex is a better predictor of in vivo activity than the overall thermodynamic stability of the complex, a concept that has important implications for the discovery of novel chemotherapeutics that normally rely on equilibrium measurements of potency.


Figures

Figure 1
Figure 1
Structure of Triclosan and the Diphenyl Ether ftuFabI Inhibitors.
Figure 2
Figure 2. X-ray Structures of ecFabI and ftuFabI
(A) Ribbon presentation of E. coli FabI with a close up view of the active site. The carbon atoms of the triclosan molecule are shown in black and in the NAD+ molecule in blue. Oxygen atoms are depicted in red, chloride atoms in green, nitrogen in blue and phosphorous in orange. (B) Loop ordering upon triclosan binding. The left panel shows the E. coli FabI (pdb code 1dfi) with bound NAD+ (blue) with the loop ends marked in red. The second panel shows the ternary triclosan-NAD+ E. coli FabI structure (pdb code 1qg6) with the loop ordered into a helix (amino acids 194 – 201 shown in red). (C) Superposition of E. coli FabI with bound NAD+, both shown in cyan and F. tularensis FabI shown in brown with bound NAD+ (yellow). In both structures the active site loop is disordered, the loop ends are marked in red. Superpositions were calculated with Superpose using secondary structure matching (43) implemented in the ccp4 program suite (44). All model illustrations were prepared with PyMOL (45).
Figure 3
Figure 3. Linear Correlation between the log MIC90 and log Ki Values for Triclosan and the Diphenyl Ether Inhibitors
Linear fits are shown for two groups of compounds, 1–6 and 7–12.
Figure 4
Figure 4. Survival Plots for Compounds 1, 4, 8, 9 and 11
Survival plots for mice infected with F. tularensis Schu4 and treated with compounds 1, 4, 8, 9 and 11.
Figure 5
Figure 5. Progress Curve Analysis of the Inhibition of ftuFabI by Compound 10
(A) Time-dependent inactivation of ftuFabI by compound 11. The solid curves represent the best fit of the data to equation 7 for slow onset inhibition. (B) kobs values from A plotted as a hyperbolic function of [I].
Figure 6
Figure 6. Linear Correlation between Percent Survival and Residence Time
A linear fit to the data from Table 2 for compound residence time and percent survival in an animal model of infection gave a straight line with r=0.99.
Scheme 1
Scheme 1. Kinetic Schemes for the Interaction of ftuFabI with Inhibitors
(A) Inhibitor binds exclusively to the E-NAD+ form of the enzyme with an equilibrium dissociation constant of Kii. (B) Inhibitor binds to both E-NAD+ and E-NADH forms of the enzyme with equilibrium dissociation constants of K1 and K2, respectively. (C) Slow onset inhibition of ftuFabI in which formation of the final E-I* inhibitor complex occurs in two steps, the second of which is the slow step.

References

    1. Sjostedt A. Intracellular survival mechanisms of Francisella tularensis, a stealth pathogen. Microbes Infect. 2006;8:561–567. - PubMed
    1. Oyston PC, Sjostedt A, Titball RW. Tularaemia: bioterrorism defence renews interest in Francisella tularensis. Nat Rev Microbiol. 2004;2:967–978. - PubMed
    1. White SW, Zheng J, Zhang YM, Rock The structural biology of type II fatty acid biosynthesis. Annu Rev Biochem. 2005;74:791–831. - PubMed
    1. Bergler H, Fuchsbichler S, Hogenauer G, Turnowsky F. The enoyl-[acyl-carrier-protein] reductase (FabI) of Escherichia coli, which catalyzes a key regulatory step in fatty acid biosynthesis, accepts NADH and NADPH as cofactors and is inhibited by palmitoyl-CoA. Eur J Biochem. 1996;242:689–694. - PubMed
    1. Zhang YM, White SW, Rock CO. Inhibiting bacterial fatty acid synthesis. J Biol Chem. 2006;281:17541–17544. - PubMed

Publication types

MeSH terms