

Femtomolar concentration detection limit and zeptomole mass detection limit for protein separation by capillary isoelectric focusing and laser-induced fluorescence detection
- PMID: 19206532
- PMCID: PMC2765481
- DOI: 10.1021/ac8025948
Femtomolar concentration detection limit and zeptomole mass detection limit for protein separation by capillary isoelectric focusing and laser-induced fluorescence detection
Abstract
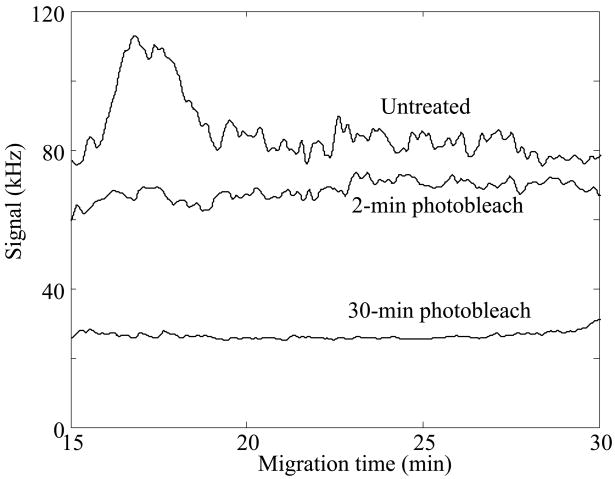
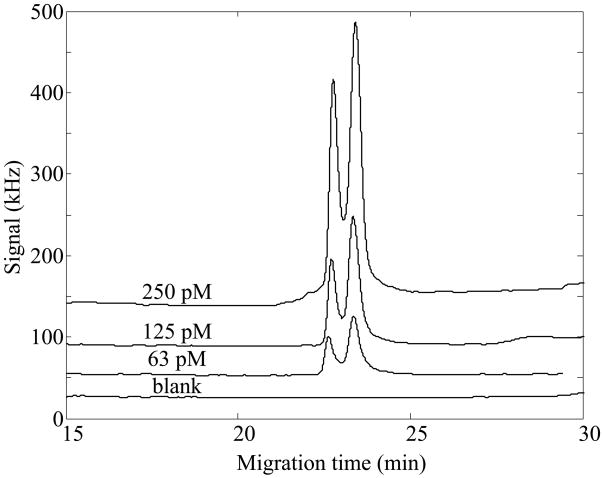
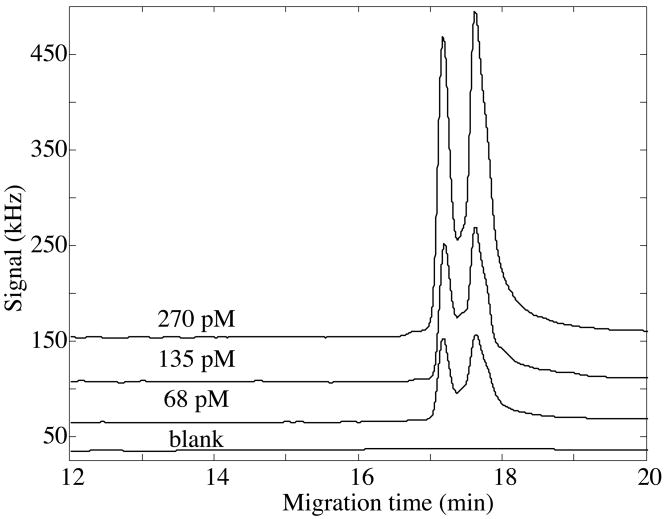
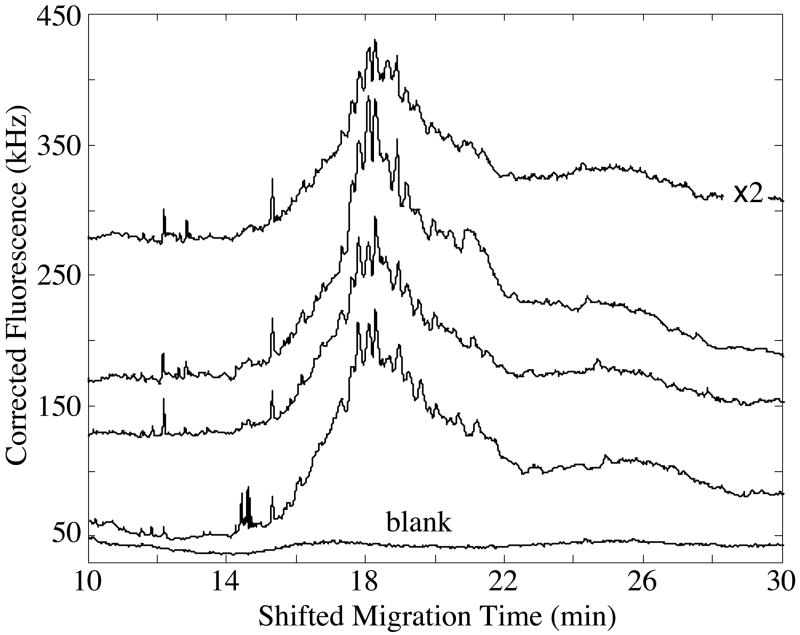
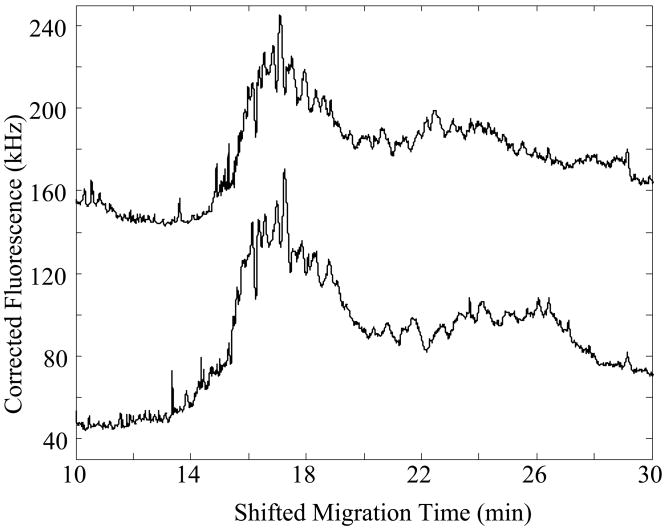
Fluorescence tends to produce the lowest detection limits for most forms of capillary electrophoresis. Two issues have discouraged its use in capillary isoelectric focusing. The first issue is fluorescent labeling of proteins. Most labeling reagents react with lysine residues and convert the cationic residue to a neutral or anionic product. At best, these reagents perturb the isoelectric point of the protein. At worse, they convert each protein into hundreds of different fluorescent products that confound analysis. The second issue is the large background signal generated by impurities within commercial ampholytes. This background signal is particularly strong when excited in the blue portion of the spectrum, which is required by many common fluorescent labeling reagents. This paper addresses these issues. For labeling, we employ Chromeo P540, which is a fluorogenic reagent that converts cationic lysine residues to cationic fluorescent products. The reaction products are excited in the green, which reduces the background signal generated by impurities present within the ampholytes. To further reduce the background signal, we photobleach ampholytes with high-power photodiodes. Photobleaching reduced the noise in the ampholyte blank by an order of magnitude. Isoelectric focusing performed with photobleached pH 3-10 ampholytes produced concentration detection limits of 270 +/- 25 fM and mass detection limits of 150 +/- 15 zmol for Chromeo P540 labeled beta-lactoglobulin. Concentration detection limits were 520 +/- 40 fM and mass detection limits were 310 +/- 30 zmol with pH 4-8 ampholytes. A homogenate was prepared from a Barrett's esophagus cell line and separated by capillary isoelectric focusing, reproducibly generating dozens of peaks. The sample taken for the separation was equal to the labeled protein homogenate from three cells.
Figures
References
-
- Bjellqvist B, Ek K, Righetti PG, Gianazza E, Görg A, Westermeier R, Postel W. J Biochem Biophys Methods. 1982;6:317–339. - PubMed
-
- Hjertén S, Elenbring K, Kilar F, Liao JL, Chen AJ, Siebert CJ, Zhu MD. J Chromatogr. 1987;403:47–61. - PubMed
-
- Jensen PK, Pasa-ToliV L, Anderson GA, Horner JA, Lipton MS, Bruce JE, Smith RD. Anal Chem. 1999;71:2076–2084. - PubMed
-
- Dovichi NJ, Zhang J. Angew Chem Int Ed Engl. 2000;39:4463–4468. - PubMed
-
- Chen DY, Dovichi NJ. Anal Chem. 1996;68:690–696.
Publication types
MeSH terms
Substances
Grants and funding
LinkOut - more resources
Full Text Sources
