

Wideband absorbance tympanometry using pressure sweeps: system development and results on adults with normal hearing
- PMID: 19206798
- PMCID: PMC2737248
- DOI: 10.1121/1.3001712
Wideband absorbance tympanometry using pressure sweeps: system development and results on adults with normal hearing
Abstract
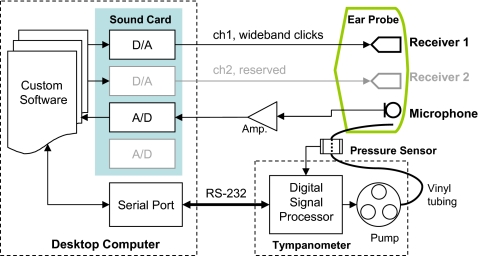
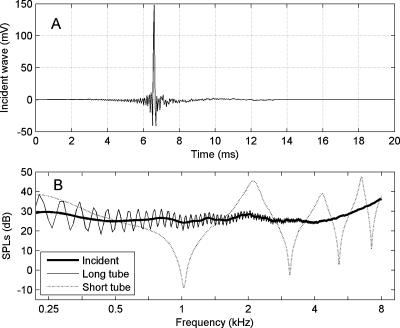
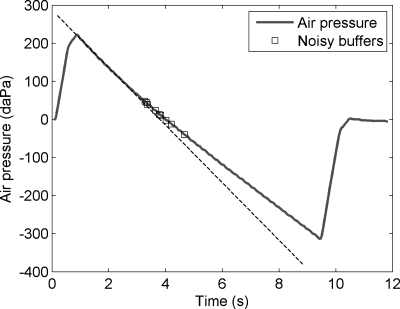
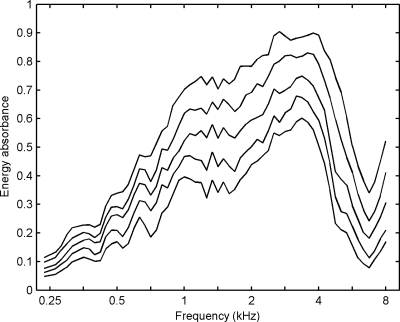
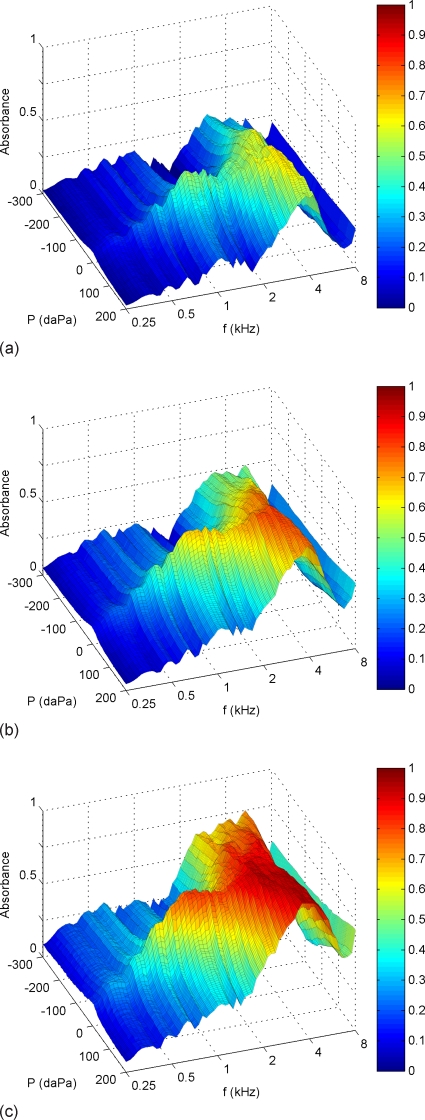
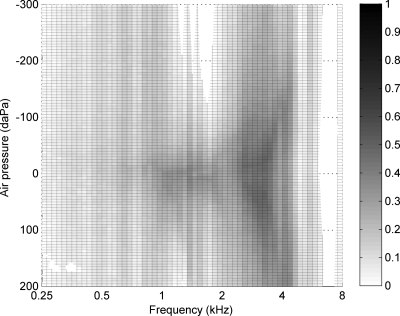
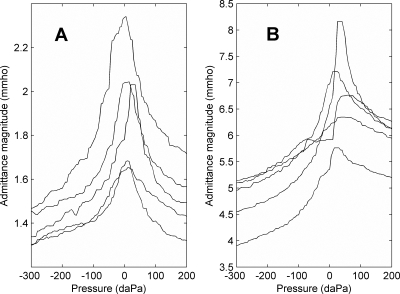
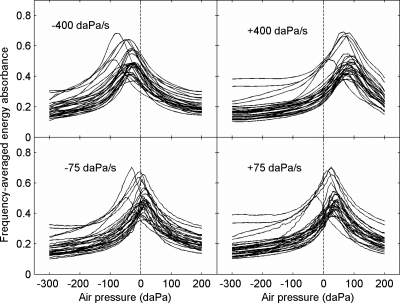
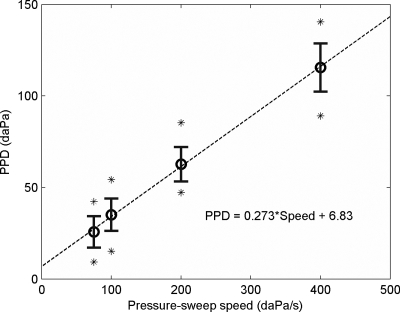
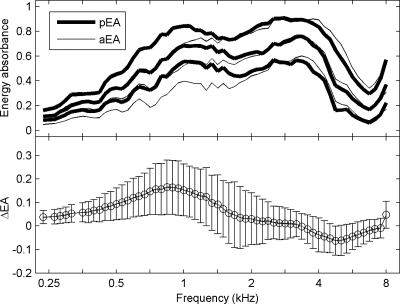
A system with potential for middle-ear screening and diagnostic testing was developed for the measurement of wideband energy absorbance (EA) in the ear canal as a function of air pressure, and tested on adults with normal hearing. Using a click stimulus, the EA was measured at 60 frequencies between 0.226 and 8 kHz. Ambient-pressure results were similar to past studies. To perform tympanometry, air pressure in the ear canal was controlled automatically to sweep between -300 and 200 daPa (ascending/descending directions) using sweep speeds of approximately 75, 100, 200, and 400 daPas. Thus, the measurement time for wideband tympanometry ranged from 1.5 to 7 s and was suitable for clinical applications. A bandpass tympanogram, calculated for each ear by frequency averaging EA from 0.38 to 2 kHz, had a single-peak shape; however, its tympanometric peak pressure (TPP) shifted as a function of sweep speed and direction. EA estimated at the TPP was similar across different sweep speeds, but was higher below 2 kHz than EA measured at ambient pressure. Future studies of EA on normal ears of a different age group or on impaired ears may be compared with the adult normal baseline obtained in this study.
Figures

References
-
- Agulló, J., Cardona, S., and Keefe, D. H. (1995). “Time-domain deconvolution to measure reflection functions from discontinuities in waveguides,” J. Acoust. Soc. Am. JASMAN10.1121/1.412068 97, 1950–1957. - DOI
-
- ASHA (1997). Guidelines for Audiologic Screening (American Speech-Language-Hearing Association, Rockville, MD: ).
-
- Baldwin, M. (2006). “Choice of probe tone and classification of trace patterns in tympanometry undertaken in early infancy,” Int. J. Audiol. ZZZZZZ 45, 417–427. - PubMed
-
- Colletti, V. (1977). “Multifrequency tympanometry,” Audiology AUDLAK 16, 278–287. - PubMed
-
- Decraemer, W. F., Creten, W. L., and van Camp, K. J. (1984). “Tympanometric middle-ear pressure determination with two-component admittance meters,” Scand. Audiol. SNADAS 13, 165–172. - PubMed
Publication types
MeSH terms
Grants and funding
LinkOut - more resources
Full Text Sources
Other Literature Sources
Miscellaneous