. 2009 Feb;125(2):980-94.
doi: 10.1121/1.3058630.

Postnatal development of sound pressure transformations by the head and pinnae of the cat: monaural characteristics

Affiliations

Postnatal development of sound pressure transformations by the head and pinnae of the cat: monaural characteristics

Daniel J Tollin et al. J Acoust Soc Am. 2009 Feb.

Abstract

Although there have been many anatomical, physiological, and psychophysical studies of auditory development in cat, there have been no comparable studies of the development of the sound pressured transformations by the cat head and pinnae. Because the physical dimensions of the head and pinnae determine the spectral and temporal transformations of sound, as head and pinnae size increase during development, the magnitude and frequency ranges of these transformations are hypothesized to systematically change. This hypothesis was tested by measuring directional transfer functions (DTFs), the directional components of head-related transfer functions, and the linear dimensions of the head and pinnae in cats from the onset of hearing ( approximately 1.5 weeks) through adulthood. Head and pinnae dimensions increased by factors of approximately 2 and approximately 2.5, respectively, reaching adult values by approximately 23 and approximately 16 weeks, respectively. The development of the spectral notch cues to source location, the spatial- and frequency-dependent distributions of DTF amplitude gain (acoustic directionality), maximum gain, and the acoustic axis, and the resonance frequency and associated gain of the ear canal and concha were systematically related to the dimensions of the head and pinnae. These monaural acoustical properties of the head and pinnae in the cat are mature by 16 weeks.


Figures

Figure 1
Figure 1
Developmental growth of the head and pinnae of the cat. The four measured dimensions are shown in the insets of (A) and (C). (A) Head diameter AB. (B) Pinna width at half-height CD. (C) Outside pinna height 1-2. (D) Inside pinna height 1-3. The measured data are from 16 animals. Data points with error bars indicate the across-animal mean±SD of the measured dimension at that age. Data points without error bars indicate single animal measurements at that age. In each panel, the solid and dashed horizontal lines indicate the mean 99% confidence interval, respectively, of the measured dimension taken from nine adult animals. The parameters of the best-fitting growth curve for each measured dimension are displayed in each panel along with the coefficient of determination (R2) for the fit.
Figure 2
Figure 2
Development of the monaural broadband spectral notch cues. (A) DTF gain for seven different elevations from −30° to 60° at 0° azimuth for cats of three different ages (upper left in each panel). (B) Plots of the isofrequency contours of the first (lowest frequency) notch frequencies, or FNF, for sources in the frontal hemispheres for the same three animals as in (A). (C) FNFs plotted as a function of elevation at 0° azimuth for animals of nine different ages. (D) Development of the first notch frequency range as a function of the development of the outside pinnae height 1-2 (n=18 animals). Symbols indicate FNF at (0°,0°) while the error bars indicate the range of FNFs observed in the frontal hemisphere. Solid line indicates the best-fitting function relating FNFs at (0°, 0°) to pinna height 1-2. Hatched region indicates the range of FNFs observed in the frontal hemisphere in adult animals.
Figure 3
Figure 3
Spatial distribution of DTF gains for seven frequencies for the right ears (e.g., −90° is ipsilateral) of three animals aged 1.3 weeks, 5 weeks, and adult. DTF gains for each animal have been normalized by the maximum gain (indicated at the upper left of each panel) at the indicated frequency (upper right of panels in last column). The contours are plotted at −3 dB intervals from the maximum gain. Color bar (bottom) indicates the relative gain with respect to the maximum gain.
Figure 4
Figure 4
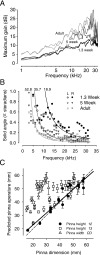
(A) Maximum acoustical gain of the head and pinnae as a function of frequency for animals aged 1.3 weeks, 5 weeks, and adult. (B) Solid angle area (in units of π sr) enclosed by the −3 dB contour from the DTF gain plots (Fig. 3) as a function of frequency. Data are shown for the left (open) and right (filled) ears of the same animals as in (A). Solid lines indicate the best-fitting circular aperture model (see text) to the data corresponding to each animal; the aperture diameter from the best-fitting function is indicated at the top of each line. (C) Scatter plot of the predicted aperture diameter from the circular aperture model fitted to the data as a function of the pinnae dimension in 19 animals. Data are shown for the three pinnae dimensions: CD, 1-2, and 1-3 in Figs. 1B, 1C, 1D, respectively. Error bars show 95% confidence intervals. Solid line shows linear regression of predicted aperture and pinnae height 1-2. Dashed line indicates line of equality.
Figure 5
Figure 5
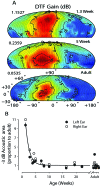
(A) Broadband DTF gain for animals aged 1.3 weeks, 5 weeks, and adult. Each plot has been normalized by the maximum DTF gain and −3 dB contours with respect to the maximum gain are plotted. The area (in units of π sr) enclosed by the −3 dB contour is indicated in the upper left of each panel. (B) The development of the −3 dB area as a function of the age of cats for the left (filled symbols) and right (open symbols) ears (n=19 animals). The −3 dB area has been normalized by the average broadband gain area in 8 (8∕19) adult animals. Solid line indicates best-fitting function to all of the data (see text).
Figure 6
Figure 6
The elevation (top panels) and azimuth (bottom panels) corresponding to the acoustic axis as a function of frequency in four animals aged 1.3, 5, and 7.1 weeks as well as adult (age indicated in upper left of each panel). The acoustic axis is the spatial location corresponding to the maximum DTF gain [Fig. 4A] at a particular frequency (see Fig. 3). Vertical dashed lines indicate frequencies where discrete transitions appear to occur in the acoustic axis.
Figure 7
Figure 7
The contribution of the pinnae to the spatial distributions of DTF gain (A), the frequency dependence of the −3 dB area of the DTF gain (B), the azimuth and elevation of the acoustic axis (C), and the maximum gain as a function of frequency (D). All data are from one animal aged 2.9 weeks. (A) DTF gain for three frequencies (upper right, left panels) with (left column) and without (right column) the pinnae. Maximum gain indicated in upper left of each panel. Axes and lines as in Fig. 3. (B) Solid angle area (in π sr) enclosing the −3 dB contours as a function of frequency for the left (open) and right (closed) ears with (black symbols) and without (red symbols) the pinnae. Solid lines indicate the predicted areas based on the circular aperture model (see text) with the diameter given at the top of each respective line. A diameter of 24.13 mm fitted the intact data the best. (C) The elevation (top) and azimuth (bottom) of the acoustic axis for the right ear with (black symbols) and without (red symbols) the pinnae. The values of the axis without pinnae have been shifted by −3° to prevent overlap. (D) Maximum gain as a function of frequency with (black) and without (red) the pinnae. The gain due to the pinnae (gray line) was computed from the difference in the gains with and without the pinnae. The two different lines for each condition in (D) correspond to the left and right ears.
Figure 8
Figure 8
Estimated development of the resonance frequency, acoustic gain, and the length of the ear canal and concha. The gain (filled) and resonance frequency (open) of the ear canal∕concha (labeled simply “canal” in the figure) were estimated from the nondirectional common components of the DTFs (see Sec. 2) in 16 animals (5∕16 were adults). Solid line shows the best-fitting three-parameter exponential decay function relating the canal∕concha resonance frequency to age in weeks. Dashed line indicates the canal∕concha length (in millimeters) estimated from the fitted resonance frequency function and assuming that the canal∕concha can be modeled as a simple cylinder of a given length and closed at one end (see text).

Similar articles

Cited by

References

    1. Aytekin, M., Grassi, E., Sahota, M., and Moss, C. F. (2004). “The bat head-related transfer function reveals binaural cues for sound localization in azimuth and elevation,” J. Acoust. Soc. Am. JASMAN10.1121/1.1811412 116, 3594–3605. - DOI - PubMed
    1. Calford, M. B., and Pettigrew, J. D. (1984). “Frequency dependence of directional amplification at the cat’s pinna,” Hear. Res. HERED310.1016/S0378-5955(00)00083-6 14, 13–19. - DOI - PubMed
    1. Carlile, S. (1990). “The auditory periphery of the ferret. I: Directional response properties and the pattern of interaural level differences,” J. Acoust. Soc. Am. JASMAN10.1121/1.400115 88, 2180–2195. - DOI - PubMed
    1. Carlile, S., and King, A. J. (1994). “Monaural and binaural spectrum level cues in the ferret: Acoustics and the neural representation of auditory space,” J. Neurophysiol. 71, 785–801. - PubMed
    1. Carlile, S., and Pettigrew, A. G. (1987). “Directional properties of the auditory periphery in the guinea pig,” Hear. Res. HERED310.1016/0378-5955(87)90117-1 31, 111–122. - DOI - PubMed

Publication types