Comparative Study
. 2009 Feb;125(2):1050-8.
doi: 10.1121/1.3050273.

Psychometric functions for pure tone intensity discrimination: slope differences in school-aged children and adults

Affiliations
Comparative Study

Psychometric functions for pure tone intensity discrimination: slope differences in school-aged children and adults

Emily Buss et al. J Acoust Soc Am. 2009 Feb.

Abstract

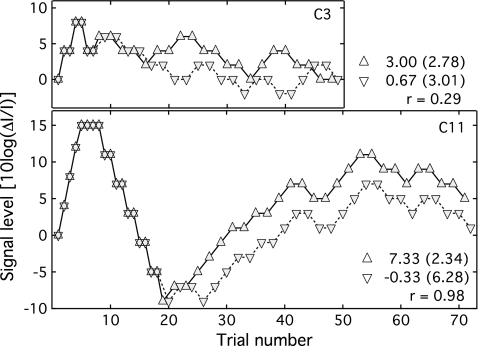
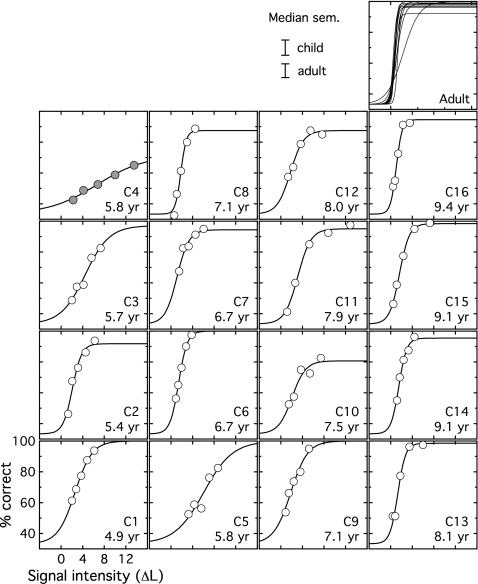
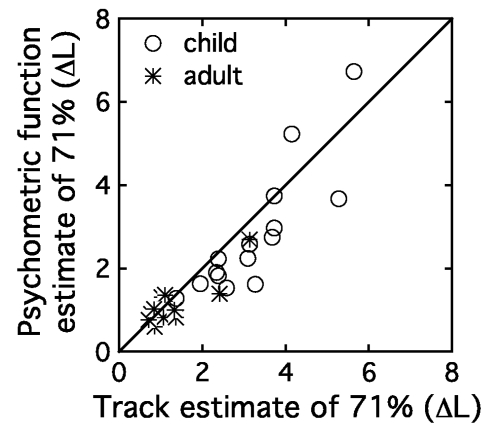
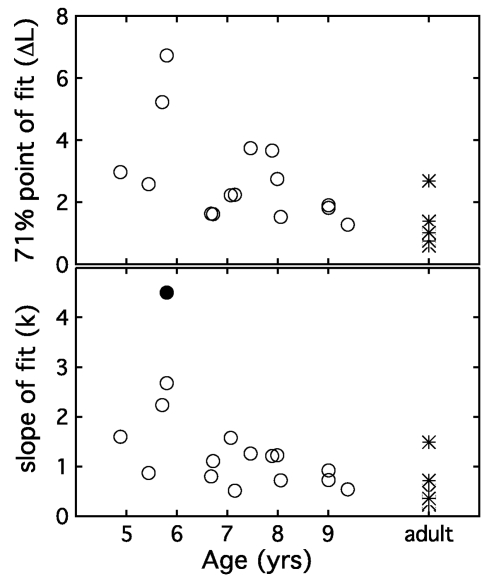
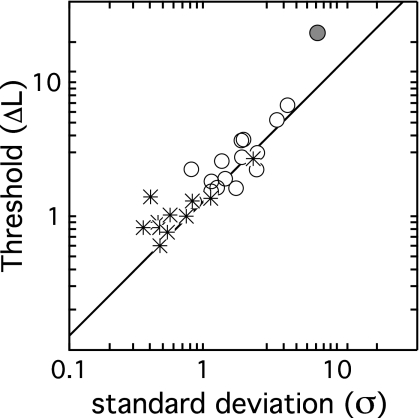
Previous work on pure tone intensity discrimination in school-aged children concluded that children might have higher levels of internal noise than adults for this task [J. Acoust. Soc. Am. 120, 2777-2788 (2006)]. If true, this would imply that psychometric function slopes are shallower for children than adults, a prediction that was tested in the present experiment. Normal hearing children (5-9 yr) and adults were tested in a two-stage protocol. The first stage used a tracking procedure to estimate 71% correct for intensity discrimination with a gated 500 Hz pure tone and a 65 dB sound pressure level standard level. The mean and standard deviation of these tracks were used to identify a set of five signal levels for each observer. In the second stage of the experiment percent correct was estimated at these five levels. Psychometric functions fitted to these data were significantly shallower for children than adults, as predicted by the internal noise hypothesis. Data from both stages of testing are consistent with a model wherein performance is based on a stable psychometric function, with sensitivity limited by psychometric function slope. Across observers the relationship between slope and threshold conformed closely to predictions of a simple signal detection model.


Figures

Figure 1
Figure 1
Signal intensity is plotted as a function of trial number for two observers. The top panel shows data for C3, which is representative of the child data. The bottom panel shows data for C11, a unique case where the two interleaved tracks were highly correlated. Symbols reflect the two tracks, which do not diverge until after the second track reversal. The legend shows the mean and standard deviation associated with each track, as well as the correlation between tracks.
Figure 2
Figure 2
Percent correct data are shown for individual child observers, plotted in percent correct as a function of intensity increment in units of ΔL. The circles show data, and the lines show data fits. Observer age is indicated in each panel, and panels are arranged with child age increasing from left to right. All adult data fits are shown in the upper right panel. The legend indicates the median standard error of the mean for each group. The filled symbols in the upper left panel highlight the fact that results of observer C4 are markedly poorer than those of other observers, as discussed in the text.
Figure 3
Figure 3
Threshold estimates based on psychometric function fits are plotted as a function of thresholds estimated in the initial tracking procedure both in units of ΔL. The circles show child data, and the stars indicate adult data. The diagonal line indicates perfect correspondence between these two estimates of 71% correct.
Figure 4
Figure 4
Two parameters of the fitted psychometric function are plotted with circles as a function of child observer age, with the filled circle indicating the slope estimate of the outlier child observer C4. The threshold value for C4 is not shown because it is greater than the 8 dB axis limit. Adult values are plotted with stars at an arbitrary point on the abscissa. The top panel indicates thresholds for 71% correct in units of ΔL, and the bottom panel shows results for function slope (k).
Figure 5
Figure 5
Thresholds in ΔL are plotted as a function of the standard deviation of the underlying cue distribution (σ), estimated for each observer based on psychometric function slope. Child data are shown with circles, and adult data are shown with stars. The solid line indicates the threshold predicted based on σ, as described in the Appendix.

References

    1. Abdala, C., and Folsom, RC. (1995). “The development of frequency resolution in humans as revealed by the auditory brain-stem response recorded with notched-noise masking,” J. Acoust. Soc. Am. JASMAN10.1121/1.414350 98, 921–930. - DOI - PubMed
    1. Allen, P., and Nelles, J. (1996). “Development of auditory information integration abilities,” J. Acoust. Soc. Am. JASMAN10.1121/1.416290 100, 1043–1051. - DOI - PubMed
    1. Allen, P., and Wightman, F. (1994). “Psychometric functions for children’s detection of tones in noise,” J. Speech Hear. Res. JSPHAH 37, 205–215. - PubMed
    1. Allen, P., and Wightman, F. (1995). “Effects of signal and masker uncertainty on children’s detection,” J. Speech Hear. Res. JSPHAH 38, 503–511. - PubMed
    1. Allen, P., Jones, R., and Slaney, P. (1998). “The role of level, spectral, and temporal cues in children’s detection of masked signals,” J. Acoust. Soc. Am. JASMAN10.1121/1.423882 104, 2997–3005. - DOI - PubMed

Publication types