

alphaII-Spectrin breakdown product cerebrospinal fluid exposure metrics suggest differences in cellular injury mechanisms after severe traumatic brain injury
- PMID: 19206997
- PMCID: PMC2848834
- DOI: 10.1089/neu.2008.0657
alphaII-Spectrin breakdown product cerebrospinal fluid exposure metrics suggest differences in cellular injury mechanisms after severe traumatic brain injury
Abstract
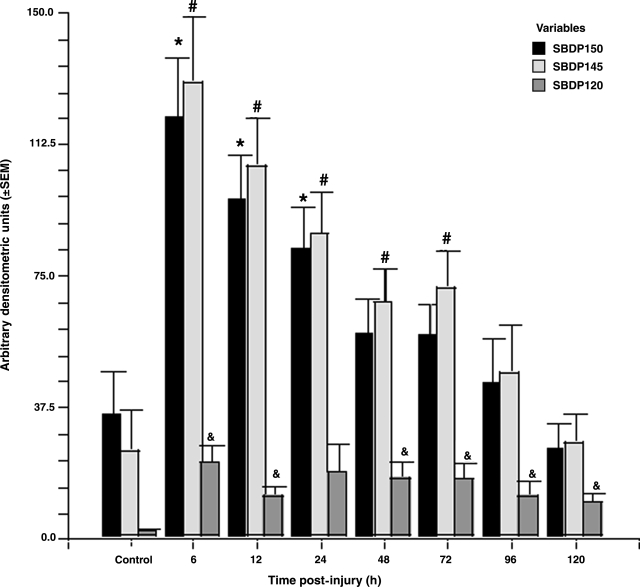
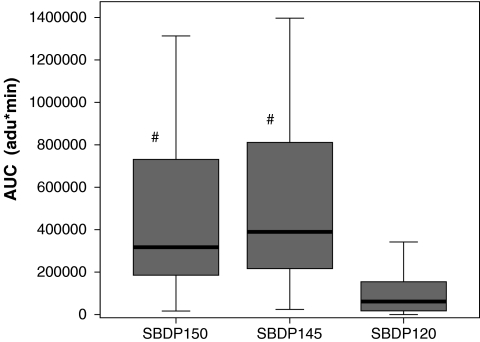
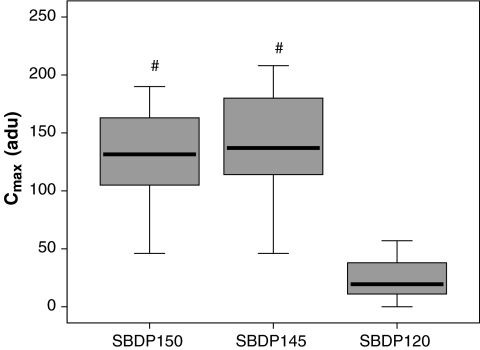
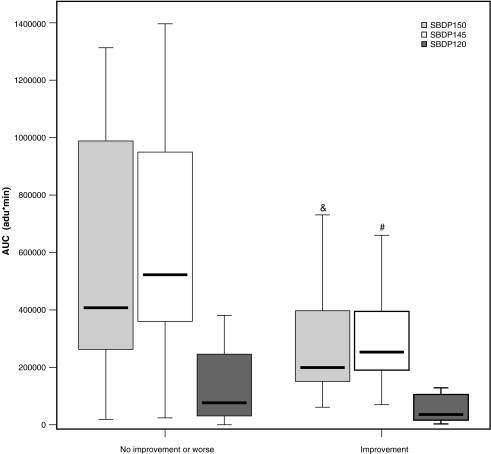
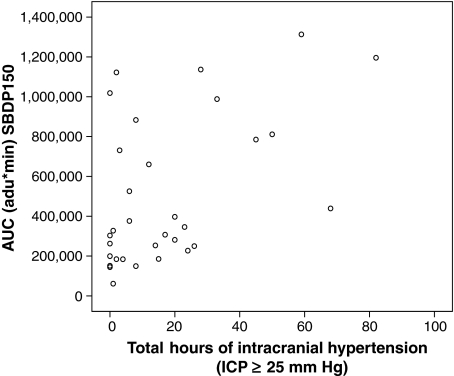
Traumatic brain injury (TBI) produces alphaII-spectrin breakdown products (SBDPs) that are potential biomarkers for TBI. To further understand these biomarkers, the present study examined (1) the exposure and kinetic characteristics of SBDPs in cerebrospinal fluid (CSF) of adults with severe TBI, and (2) the relationship between these exposure and kinetic metrics and severity of injury. This clinical database study analyzed CSF concentrations of 150-, 145-, and 120-kDa SBDPs in 38 severe TBI patients. Area under the curve (AUC), mean residence time (MRT), maximum concentration (C(max)), time to maximum concentration (T(max)), and half-life (t(1/2)) were determined for each SBDP. Markers of calpain proteolysis (SBDP150 and SBDP145) had a greater median AUC and C(max) and a shorter MRT than SBDP120, produced by caspase-3 proteolysis in the CSF in TBI patients ( p < 0.001). AUC and MRT for SBDP150 and SBDP15 were significantly greater in patients with worse Glasgow Coma Scale (GCS) scores at 24 h after injury compared to those whose GCS scores improved (AUC p=0.013, MRT p=0.001; AUC p=0.009, MRT p=0.021, respectively). A positive correlation was found between patients with longer elevations in intracranial pressure (ICP) measurements of 25mmHg or higher and those with a greater AUC and MRT for all three biomarkers. This is the first study to show that the biomarkers of proteolysis differentially associated with calpain and caspase-3 activity have distinct CSF exposure profiles following TBI that suggest a prominent role for calpain activity. Further studies are being conducted to determine if exposure and kinetic metrics for biofluid-based biomarkers can predict clinical outcome.
Figures
References
-
- Binder S. Corrigan J.D. Langlois J.A. The public health approach to traumatic brain injury: an overview of CDC's research and programs. J. Head Trauma Rehabil. 2005;20:189–195. - PubMed
-
- Brain Trauma Foundation. The American Association of Neurological Surgeons. The Joint Section on Neurotrauma and Critical Care. Intracranial pressure thresholds. J. Neurotrauma. 2000;17:493–495. - PubMed
-
- Foerch C. Singe O.C. Neumann-Haefelin T. du Mesnil de Rochemont R. Steinmetz H. Sitzer M. Evaluation of serum S100B as a surrogate marker for long-term outcome and infarct volume in acute middle cerebral artery infarction. Arch. Neurol. 2005;62:130–134. - PubMed
-
- Ghanem G. Loir B. Morandini R. Sales F. Lienard D. Eggermont A. Lejeune F. On the release and half-life of S100B protein in the peripheral blood of melanoma patients. Int. J. Cancer. 2001;94:586–590. - PubMed
-
- Gibaldi M. Peirrier D. Pharmacokinetics. 2nd. Marcel Dekker; New York: 1982.
Publication types
MeSH terms
Substances
Grants and funding
LinkOut - more resources
Full Text Sources
Other Literature Sources
Research Materials
