

Methods for comparative metagenomics
- PMID: 19208111
- PMCID: PMC2648729
- DOI: 10.1186/1471-2105-10-S1-S12
Methods for comparative metagenomics
Abstract
Background: Metagenomics is a rapidly growing field of research that aims at studying uncultured organisms to understand the true diversity of microbes, their functions, cooperation and evolution, in environments such as soil, water, ancient remains of animals, or the digestive system of animals and humans. The recent development of ultra-high throughput sequencing technologies, which do not require cloning or PCR amplification, and can produce huge numbers of DNA reads at an affordable cost, has boosted the number and scope of metagenomic sequencing projects. Increasingly, there is a need for new ways of comparing multiple metagenomics datasets, and for fast and user-friendly implementations of such approaches.
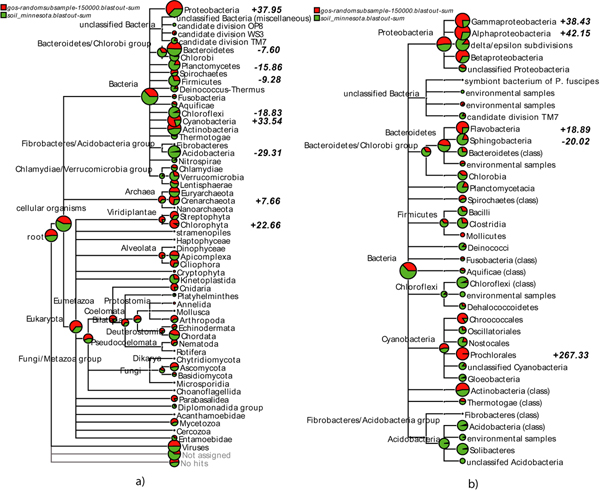
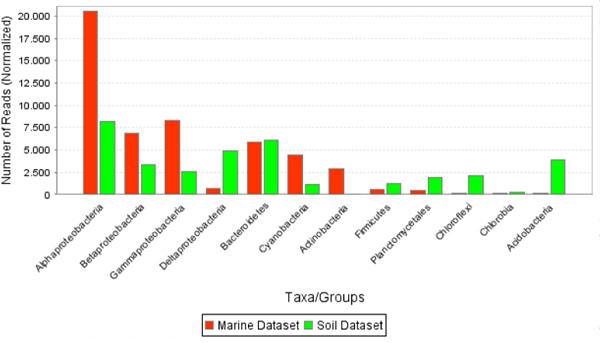
Results: This paper introduces a number of new methods for interactively exploring, analyzing and comparing multiple metagenomic datasets, which will be made freely available in a new, comparative version 2.0 of the stand-alone metagenome analysis tool MEGAN.
Conclusion: There is a great need for powerful and user-friendly tools for comparative analysis of metagenomic data and MEGAN 2.0 will help to fill this gap.
Figures
References
-
- Margulies M, Egholm M, Altman W, Attiya S, Bader J, Bemben L, Berka J, Braverman M, Chen YJ, Chen Z, Dewell SLD, Fierro J, Gomes X, Godwin B, He W, Helgesen S, Ho C, Irzyk G, Jando S, Alenquer M, Jarvie T, Jirage K, Kim JB, Knight J, Lanza J, Leamon J, Lefkowitz S, Lei M, Li J, Lohman K, Lu H, Makhijani V, McDade K, McKenna M, Myers E, Nickerson E, Nobile J, Plant R, Puc B, Ronan M, Roth G, Sarkis G, Simons J, Simpson J, Srinivasan M, Tartaro K, Tomasz A, Vogt K, Volkmer G, Wang S, Wang Y, Weiner M, Yu P, Begley R, Rothberg J. Genome sequencing in microfabricated high-density icolitre reactors. Nature. 2005;437:376–380. - PMC - PubMed
-
- GOLD: GenomesOnLine Database http://www.genomesonline.org
Publication types
MeSH terms
LinkOut - more resources
Full Text Sources
Other Literature Sources
Molecular Biology Databases
Miscellaneous
