

doi: 10.1186/gb-2009-10-2-r14.
EpiGRAPH: user-friendly software for statistical analysis and prediction of (epi)genomic data
Affiliations
- PMID: 19208250
- PMCID: PMC2688269
- DOI: 10.1186/gb-2009-10-2-r14
Item in Clipboard
EpiGRAPH: user-friendly software for statistical analysis and prediction of (epi)genomic data
Genome Biol.
.
Abstract
The EpiGRAPH web service http://epigraph.mpi-inf.mpg.de/ enables biologists to uncover hidden associations in vertebrate genome and epigenome datasets. Users can upload sets of genomic regions and EpiGRAPH will test multiple attributes (including DNA sequence, chromatin structure, epigenetic modifications and evolutionary conservation) for enrichment or depletion among these regions. Furthermore, EpiGRAPH learns to predictively identify similar genomic regions. This paper demonstrates EpiGRAPH's practical utility in a case study on monoallelic gene expression and describes its novel approach to reproducible bioinformatic analysis.
Figures
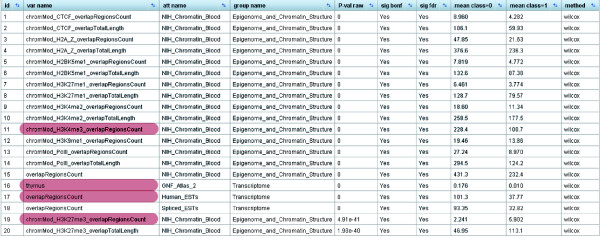
Results screenshot of EpiGRAPH's statistical analysis identifying significant differences between the promoter regions of monoallelically versus biallelically expressed genes. Comparing the promoter regions of monoallelically expressed genes (class = 1) with those of biallelically expressed genes (class = 0), EpiGRAPH's statistical analysis detects highly significant differences in terms of chromatin structure and transcriptional activity. P-values in this table are based on the nonparametric Wilcoxon rank-sum test ('method' column). Multiple hypothesis testing was accounted for with both the highly conservative Bonferroni method ('sig bonf' column) and the false discovery rate method ('sig fdr' column). A global significance threshold of 5% was used in both cases. Attributes highlighted in red are discussed in the main text. An explanation of attribute names is available from the EpiGRAPH website [29].
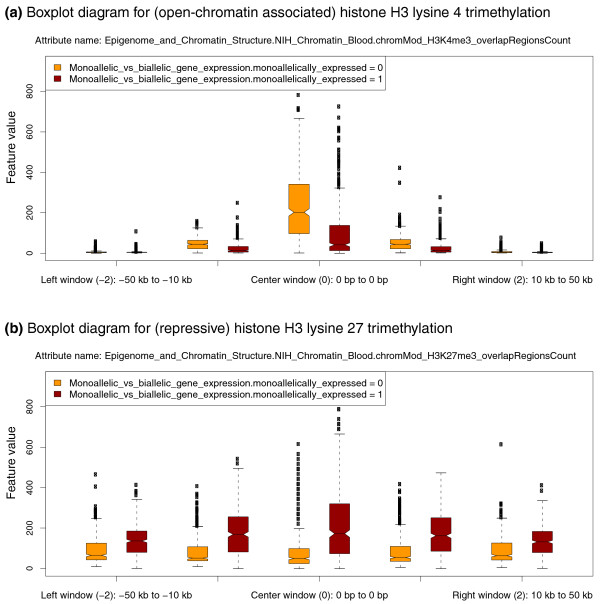
EpiGRAPH-generated diagrams highlighting differential histone modification patterns for the promoters of monoallelically versus biallelically expressed genes. This figure displays EpiGRAPH-generated boxplots comparing the promoter regions of genes exhibiting monoallelic (red boxplots) versus biallelic gene expression (yellow boxplots) with respect to their enrichment for two histone modifications, (a) H3 lysine 4 trimethylation and (b) H3 lysine 27 trimethylation. The y-axis plots the frequency of overlap with ChIP-seq tags [37], which is indicative of the strength of enrichment of the corresponding histone modification. Boxplots are in standard format (boxes show center quartiles, whiskers extend to the most extreme data point, which is no more than 1.5 times the interquartile range from the box) and outliers are shown as crosses.
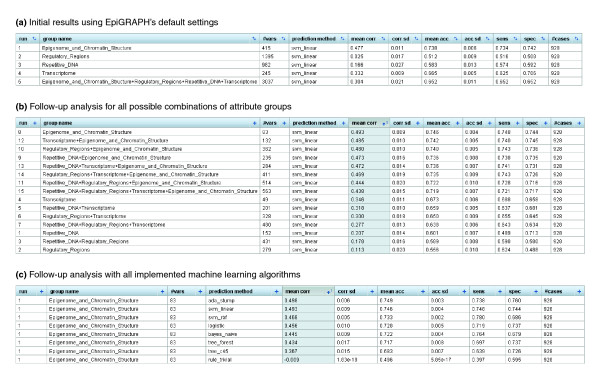
Results screenshots of EpiGRAPH's machine learning module predicting monoallelic gene expression. (a-c) These screenshots display the results of machine learning analyses comparing the promoter regions of monoallelically expressed genes (class = 1) with those of biallelically expressed genes (class = 0), each panel being based on different EpiGRAPH settings. The table values in the tables summarize the average performance of a linear support vector machine or alternative machine learning algorithms (c) that were trained and evaluated in ten repetitions of a tenfold cross-validation. Performance measures include mean correlation ('mean corr' column), prediction accuracy ('mean acc' column), sensitivity ('sens' column) and specificity ('spec' column). Additional columns display standard deviations observed among the repeated cross-validations with random partition assignment ('corr sd' and 'acc sd'), the number of variables in each attribute group ('#vars') and the total number of genomic regions included in the analysis ('#cases').
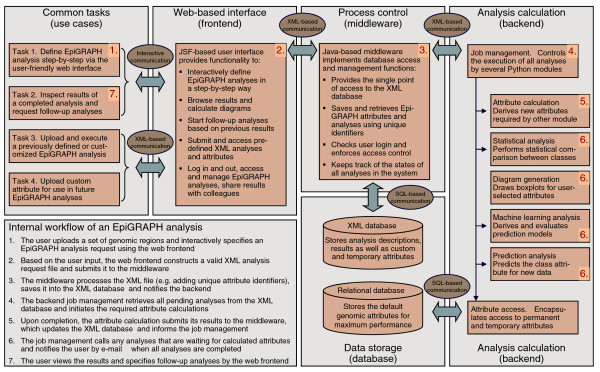
Outline of EpiGRAPH's software architecture. This figure displays a schematic overview of EpiGRAPH's software components, and it describes their interaction in a typical analysis workflow. The red numbers indicate the key component(s) for each step of the workflow description outlined in the bottom left of the figure. JSF, Java Server Faces (which is a Java-based web application framework).
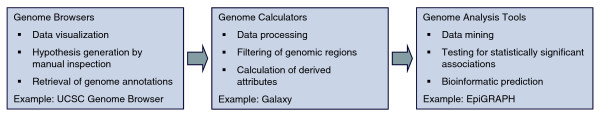
Workflow for web-based analysis of large genome and epigenome datasets. This figure outlines a workflow for the analysis of genome and epigenome data using publicly available web services. Initially, the user uploads a newly generated dataset into a genome browser, which visualizes the data and facilitates hypothesis generation by manual inspection (left box). Next, data can be processed with a genome calculator such as Galaxy, in order to extract interesting regions for in-depth analysis (center box). Finally, genome analysis tools such as EpiGRAPH facilitate the search for significant associations with genome annotation data and enable bioinformatic prediction of genomic regions with similar characteristics as the input dataset (right box).
References
-
- Mardis ER. The impact of next-generation sequencing technology on genetics. Trends Genet. 2008;24:133–141. - PubMed
Publication types
MeSH terms
LinkOut - more resources
Full Text Sources
Other Literature Sources
