

A mathematical model of hepatitis C virus dynamics in patients with high baseline viral loads or advanced liver disease
- PMID: 19208338
- PMCID: PMC2883911
- DOI: 10.1053/j.gastro.2008.12.060
A mathematical model of hepatitis C virus dynamics in patients with high baseline viral loads or advanced liver disease
Abstract
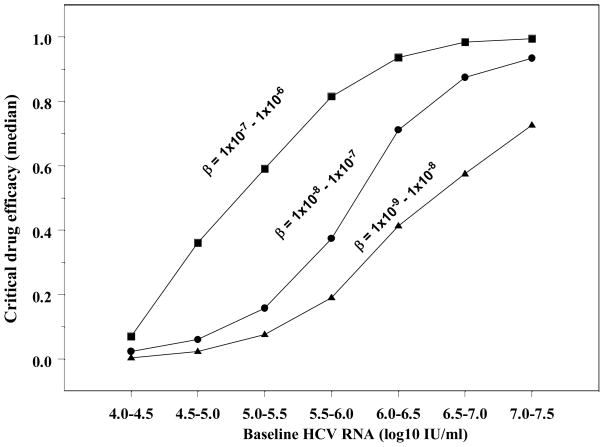
Background & aims: Patients with baseline hepatitis C virus-RNA levels (bHCV-RNA)>6 log IU/mL or cirrhosis have a reduced probability of a sustained-virologic response (SVR). We examined the relation between bHCV-RNA, cirrhosis, and SVR with a mathematical model that includes the critical-drug efficacy (epsilonc; the efficacy required for a drug to clear HCV), the infection-rate constant (beta), and the percentage of HCV-infected hepatocytes (pi).
Methods: The relation between baseline factors and SVR was evaluated in 1000 in silico HCV-infected patients, generated by random assignment of realistic host and viral kinetic parameters. Model predictions were compared with clinical data from 170 noncirrhotic and 75 cirrhotic patients.
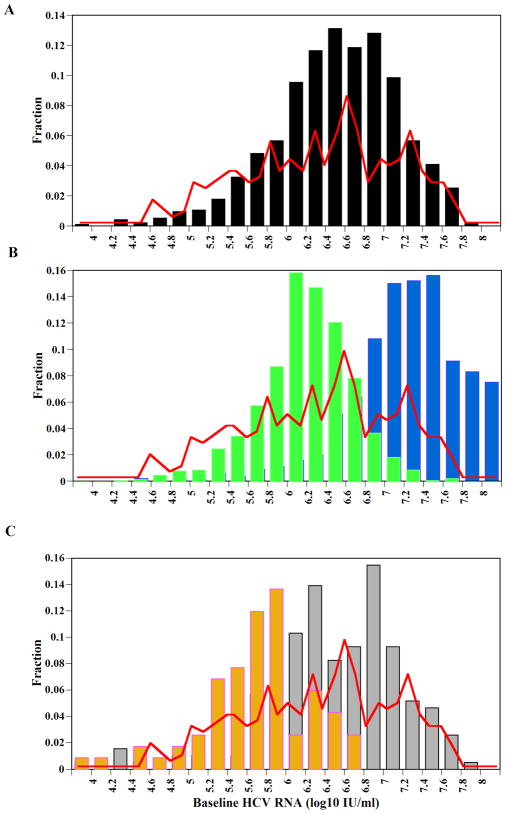
Results: The ranges chosen for beta and the viral production rate (p) resulted in bHCV-RNA levels that were in agreement with the distribution observed in US patients. With these beta and p values, higher bHCV-RNA levels led to higher epsilonc, resulting in lower SVR rates. However, higher beta values resulted in lower bHCV-RNA levels but higher pi and (epsilonc), predicting lower rates of SVR. Cirrhotic patients had lower bHCV-RNA levels than noncirrhotic patients (P=.013), and more had bHCV-RNA levels<6 log IU/mL (P<.001). Even cirrhotic patients with lower bHCV-RNA levels had lower SVR rates. An increase in beta could explain the results observed in cirrhotic patients.
Conclusions: Our model predicts that higher bHCV-RNA levels lead to higher epsilonc, reducing the chance of achieving SVR; cirrhotic patients have lower SVR rates because of large pi values, caused by increased rates of hepatocyte infection.
Conflict of interest statement
No conflicts of interest exist.
Figures
References
-
- NIH. National Institutes of Health Consensus Development Conference: management of hepatitis C: 2002. Hepatology. 2002;36:S3–20. - PubMed
-
- Fried MW, Shiffman ML, Reddy KR, et al. Peginterferon alfa-2a plus ribavirin for chronic hepatitis C virus infection. N Engl J Med. 2002;347:975–982. - PubMed
-
- Manns MP, McHutchison JG, Gordon SC, et al. Peginterferon alfa-2b plus ribavirin compared with interferon alfa-2b plus ribavirin for initial treatment of chronic hepatitis C: a randomised trial. Lancet. 2001;358:958–965. - PubMed
-
- Mihm U, Herrmann E, Sarrazin C, et al. Review article: predicting response in hepatitis C virus therapy. Aliment Pharmacol Ther. 2006;23:1043–54. - PubMed
-
- Poynard T, Marcellin P, Lee SS, et al. Randomised trial of interferon alpha2b plus ribavirin for 48 weeks or for 24 weeks versus interferon alpha2b plus placebo for 48 weeks for treatment of chronic infection with hepatitis C virus. International Hepatitis Interventional Therapy Group (IHIT) Lancet. 1998;352:1426–1432. [see comments] - PubMed
Publication types
MeSH terms
Substances
Grants and funding
LinkOut - more resources
Full Text Sources
Medical
Research Materials
Miscellaneous
